Uncertainty analysis
[1]:
# This file is part of ILTpy examples.
# Author : Dr. Davis Thomas Daniel
# Last updated : 16.06.2026
This example shows steps to generate uncertainty estimates for distributions. It is recommended to familiarize yourself with the first example in the EPR section before continuing.
As an example, an EPR inversion recovery dataset is used.
The same approach and functions can also be used for any multi-dimensional data using ILTpy.
The method
iltstatsofIltDataclass is used.Results after calling
iltstatsare stored inIltData.statisticsIltData.statisticsis a dictionary containing the following keys:g_list : A list with indiviudal distributions from
ninversions.fit_list : A list with indiviudal fits from
ninversions.residuals_list : A list with indiviudal residuals from
ninversions.noise_samples : A list with noise samples used to generate
nnumber of data samples.data_samples : A list with
nnumber of data samples.g_mean : Mean of
ndistrbutions.fit_mean : Mean of
nfits.residuals_mean : Mean of
nresiduals.g_std : Standard deviation of
ndistributions.fit_std : Standard deviation of
nfits.residuals_std : Standard deviation of
nresiduals.g_conf_interval : A list containing g_mean-std_mean, g_mean+std_mean.
fit_conf_interval : A list containing fit_mean-fit_std, fit_mean+fit_std.
Imports
[5]:
# import iltpy
import iltpy as ilt

# other libraries for handling data, plotting
import numpy as np
import matplotlib.pyplot as plt

print(f"ILTpy version: {ilt.__version__}")
ILTpy version: 1.1.0
Loading data
[6]:
# Load data
data_EPR = np.loadtxt('../../../examples/EPR/inversion_recovery/data.txt')
t_EPR = np.loadtxt('../../../examples/EPR/inversion_recovery/dim1.txt')

coalIR = ilt.iltload(data=data_EPR,t=t_EPR)
Data preparation
[7]:
# Set noise variance to 1.
## estimate noise level using some points at the end of inversion recovery trace
noise_lvl  = np.std(coalIR.data[900:])

# Scale the data with the noise level
coalIR.data = coalIR.data/noise_lvl
Initial inversion
[9]:
# Initialize the IltData object
# Tau generated internally
coalIR.init(kernel=ilt.Exponential())

# Invert
coalIR.invert()
/Users/davisthomasdaniel/sciebo/JuGit/iltpy_iet1/iltpy/src/iltpy/input/parameters.py:709: UserWarning: tau[0] was not specified, proceeding with ILTpy-generated tau. Note that ILTpy-generated tau is only valid in case of NMR/EPR relaxation data.
  warnings.warn(tau_warn)
Starting iterations ...
100%|██████████| 100/100 [00:00<00:00, 360.36it/s, Convergence=9.11e-03]
Done.
Uncertainity analysis
ncontrols the number of data samples which will be generated andn_jobscontrols the number of parallel jobs to create.
[10]:
coalIR.iltstats(n=200,n_jobs=-1)
[Parallel(n_jobs=-1)]: Using backend LokyBackend with 8 concurrent workers.
[Parallel(n_jobs=-1)]: Done  34 tasks      | elapsed:    1.4s
[Parallel(n_jobs=-1)]: Done 184 tasks      | elapsed:    5.4s
[Parallel(n_jobs=-1)]: Done 200 out of 200 | elapsed:    5.9s finished
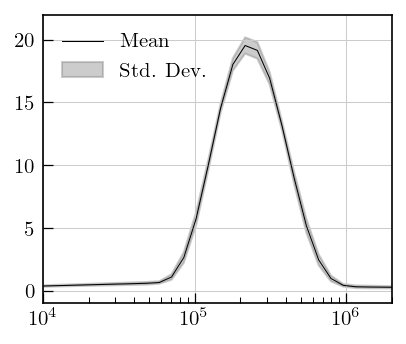
Plot results
[12]:
fig,ax = plt.subplots(figsize=(5,3.5))
ax.semilogx(coalIR.tau[0].flatten(),-coalIR.statistics['g_mean'],color='k',linewidth=0.5,label='Mean')
ax.fill_between(coalIR.tau[0].flatten(),*[-i for i in coalIR.statistics['g_conf_interval']],color='grey',alpha=0.4,label='Std. Dev.')
ax.legend()
plt.xlim(1e4,2e6)
_=plt.ylim(-1,22)