Parallel Debugging and Performance Analysis
A description of a number of available tools can be found in the slides from the last Supercomputer Usage class.
Debugging with TotalView on JURECA
TotalView is a very powerful debugger supporting C, C++, Fortran 77, Fortran 90, PGI HPF and assembler programs and offers among others the following features:
Support for debugging of multi-process and multi-threaded applications
C++ support (templates, inheritance, inline functions)
F90 support (user types, pointers, modules)
1D + 2D Array Data visualization
Support for parallel debugging (MPI: automatic attach, message queues, OpenMP, pthreads)
Scripting and batch debugging
Memory Debugging
Reverse Debugging with ReplayEngine
Using TotalView
In order to be able to use TotalView, you need to setup an internal ssh-key pair, containing specific information. Please contact sc@fz-juelich.de for instructions.
You will also need to enable two features of SSH:
To allow TotalView to transmit its graphical user interface from JURECA to your machine make sure to turn on the X11 forwarding feature. If you are using OpenSSH (which is the default on most Linux machines) this is done by adding the
-X(or-Yif-Xdoes not work) arguments when calling thesshcommand to log in to JURECA. Also, your local client (laptop or workstation) should be running an X server that displays the GUI on your end. An X server for Windows can, for example, be downloaded from http://www.straightrunning.com/XmingNotes. An X server for Mac OS X is available from http://www.xquartz.org.TotalView in recent versions itself makes use of SSH to set up connections between different nodes of the supercomputer. Making the necessary login credentials available to the SSH client running on JURECA’s login nodes is best achievid by turning on the agent forwarding feature. For OpenSSH this is done by adding the
-Aoption when calling thesshcommand to log in to JURECA.
In summary, use ssh -XA (or ssh -YA) to connect if you want to use TotalView.
More details about accessing the JURECA login nodes can be found here.
Once you are logged in to JURECA (with X11 forwarding and agent forwarding enabled) load the modules (mind the capital T and V in Totalview’s name):
module load TotalView intel-para
Before executing TotalView we advise to allocate an interactive session using salloc as described in Interactive Sessions.
Once the allocation is active, salloc starts a shell on the login node in which TotalView can be run.
We recommend to start TotalView in direct mode which works by prepending the invocation that you would normally use to start your parallel application with totalview -args, i.e., if you normally start your application as follows:
srun -n 4 ./my_application
to debug it using TotalView you instead execute:
totalview -oldUI -args srun -n 4 ./my_application
This will launch the (old) TotalView GUI which displays a dialog that allows you to turn on or off some optional features:
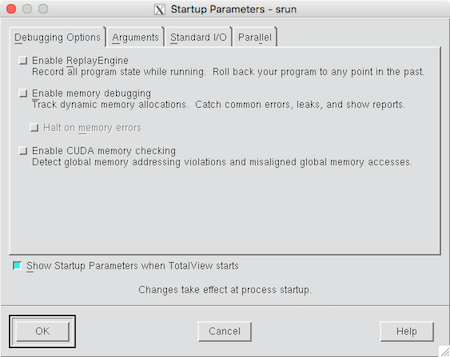
Enable ReplayEngine: reverse debugging capability records the execution history of your program and makes that history available for diagnosis. This new approach - working back from a failure, error, or crash to its root cause - eliminates the need to restart your program repeatedly with different breakpoint locations. The ability to do reverse debugging, stepping freely both forwards and backwards through program execution, drastically reduces the amount of time invested in troubleshooting your code.
Enable memory debugging: the memory debugging functions of TotalView are packaged as a separate, but integrated, client called MemoryScape. This option enables its use. Run your program under TotalView as usual, to a stopping point. Then launch MemoryScape:
The MemoryScape main window should then appear.
Enable CUDA memory checking: if your application uses CUDA, you can debug its directives here.
Press OK.
The dialog disappears and TotalView’s main window moves to the front.
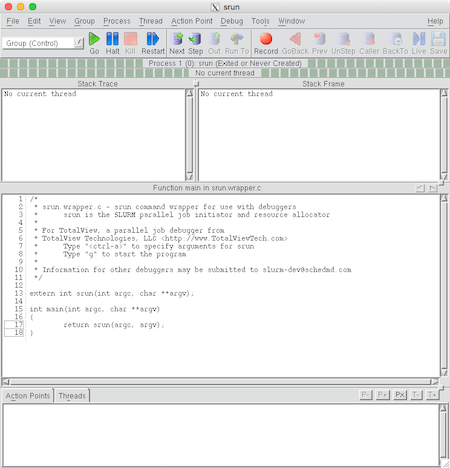
Press Go in the tool bar.
TotalView launches the
srunprocess launcher and comes back with a question:
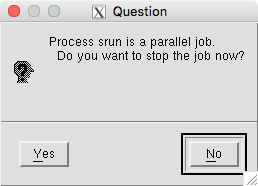
Press Yes.
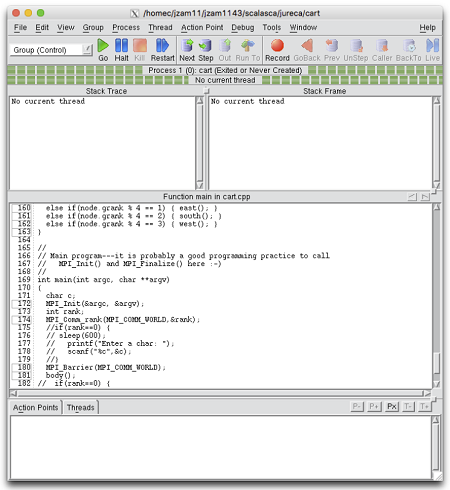
Now your application is launched and TotalView will pause its execution at the entry point (e.g. the
mainfunction of a C program).
TotalView’s online help cannot be directly accessed from JURECA. Please check TotalView’s help files for usage.
Memory Debugging with TotalView
In order to support memory debugging with TotalView using the MemoryScape tool one needs to link the code with MemoryScape’s heap agent. To do so for the following parameters should be added to the compilation/linking step:
-L$(PATH) -ltvheap_64 -Wl,-rpath,$(PATH)
where PATH equals:
$(EBROOTTOTALVIEW)/toolworks/totalview.$(EBVERSIONTOTALVIEW)/linux-x86-64/lib