Examples
Here we list examples on some cases where the reports generated by LLview were used to identify behaviours or to solve issues either on the system, on the program, or on the job configuration.
High CPU Load with low CPU usage
A job usually tries to use all cores on the HPC system by generating a load that is compatible to the available cores (in case other resources - such as available memory - are not a restriction). However, if the configuration or the pinning is not done correctly, if can happen that the load generated by the user program is not distributed correctly among the available cores on the compute node.
This can be seen in the list of jobs of LLview by checking the columns CPU Load and CPU Usage:
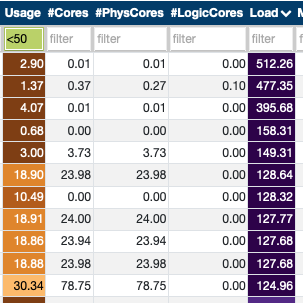
Although this can happen show up for jobs that are just running for a couple of minutes, it may indicate that something is wrong on jobs that are running for a longer time.
A job that was running with a CPU load close to 256 (the number of possible threads on the compute nodes) but only 50% of CPU usage presented the following distribution per core:
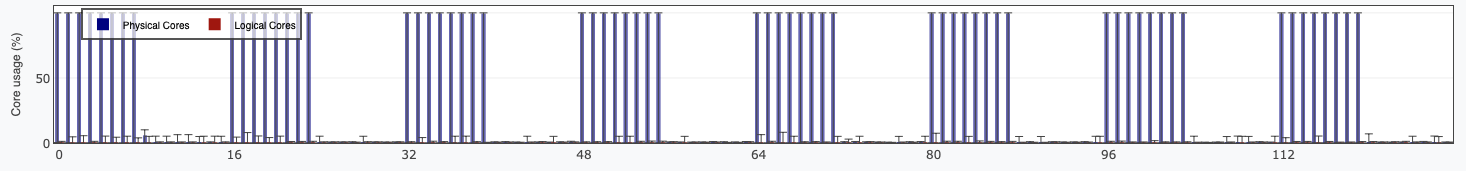
Even though the number of processes/threads included eventual simultaneous multithreading (SMT) usage, the graph indicates that no logical cores were used. Not only that, but even some of the "physical cores" were also not being used.
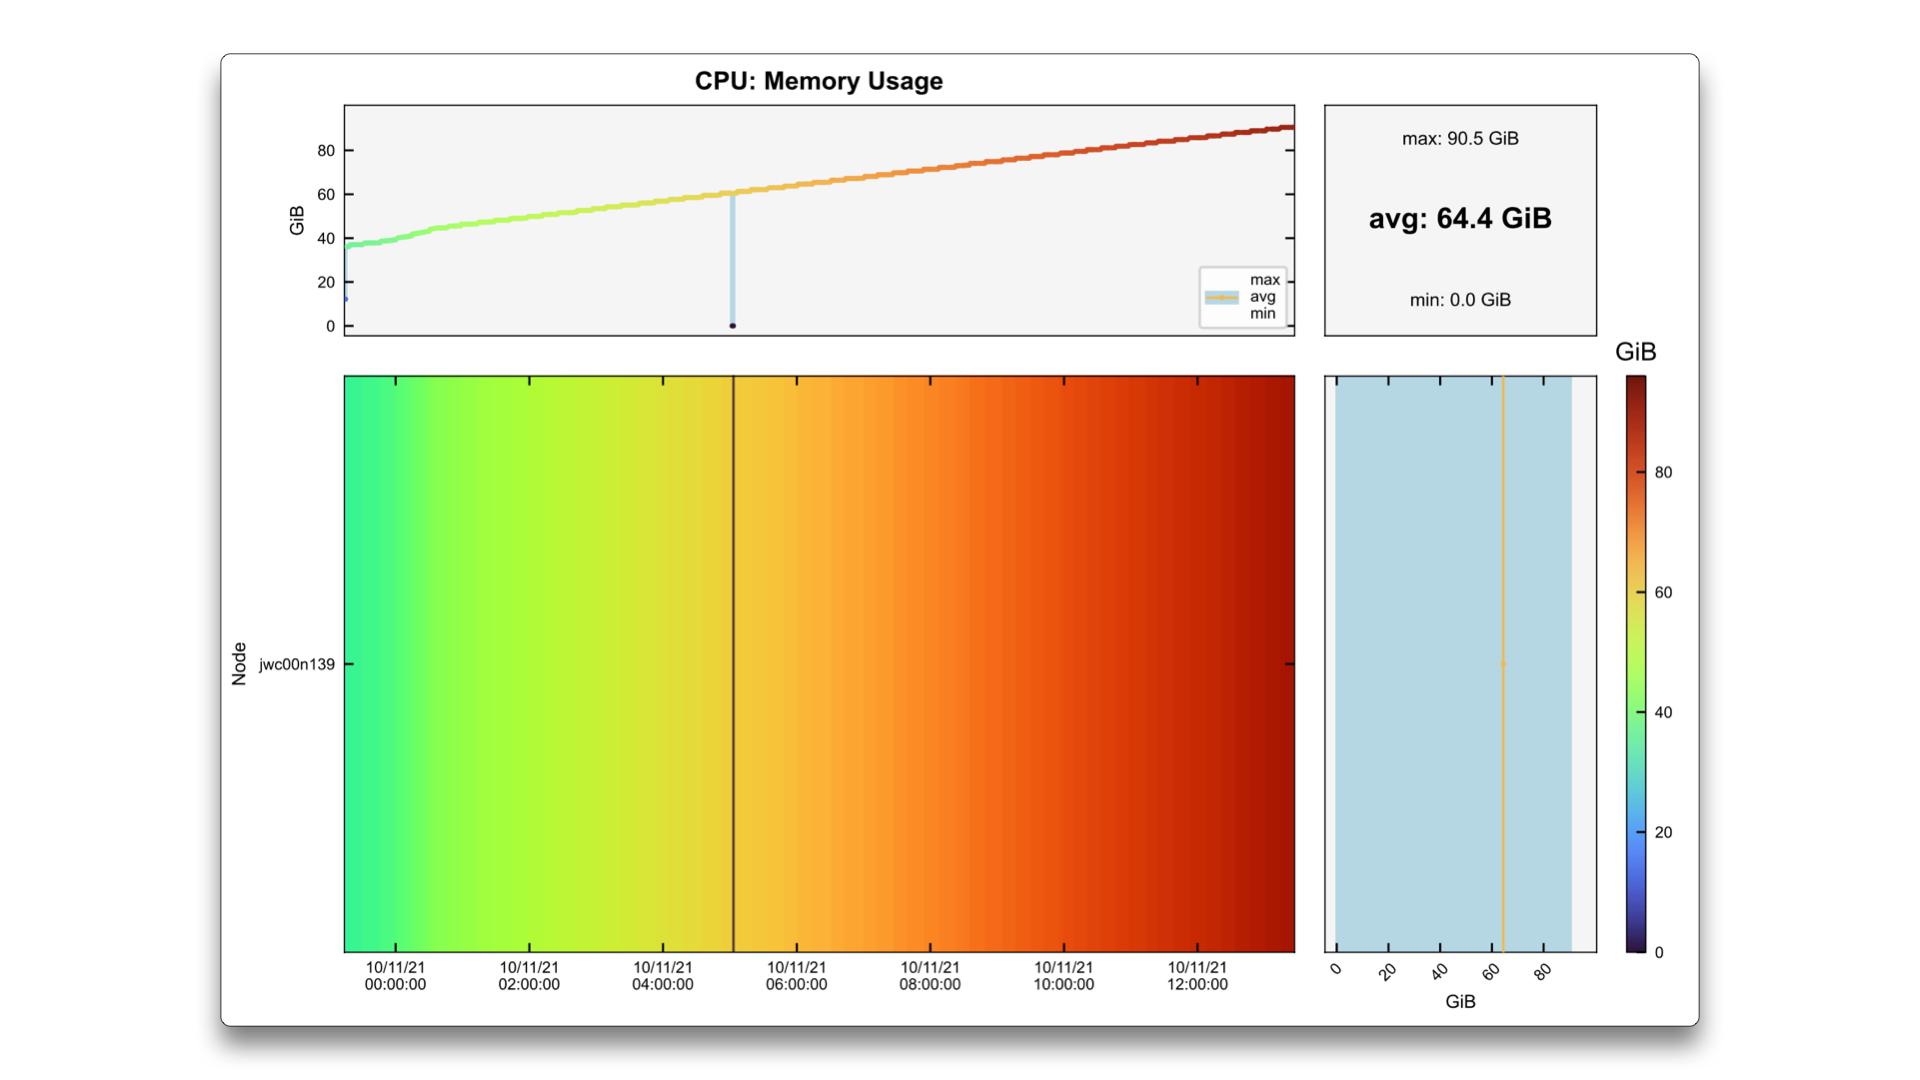
On the HTML report, the distribution of core usage per node was indicated in the following graph:

As it can also be seen from this colorplot, not only the "Logical" cores (the second half of the cores) were not used, neither some of the "Physical" (the first half) cores.
The problem in this case was a change on the Slurm configuration that was not passing the variable cpus-per-task to the srun commands. After fixing this issue, the CPU usage went up to close to 200%, as expected.
Memory leak
A common case of errors is when the job runs out of memory.
This can be identified via the system report error mentioning oom-killer.
In this case, LLview detailed reports also display the message (Out-of-memory) on the initial header summary.
The cause of the memory overload can be simply a regular increase of a system size, a misconfiguration, but also it can originate on a memory leak. This means that the program is constantly allocating more and more memory without freeing it up, even though some variables/matrices are not used anymore.
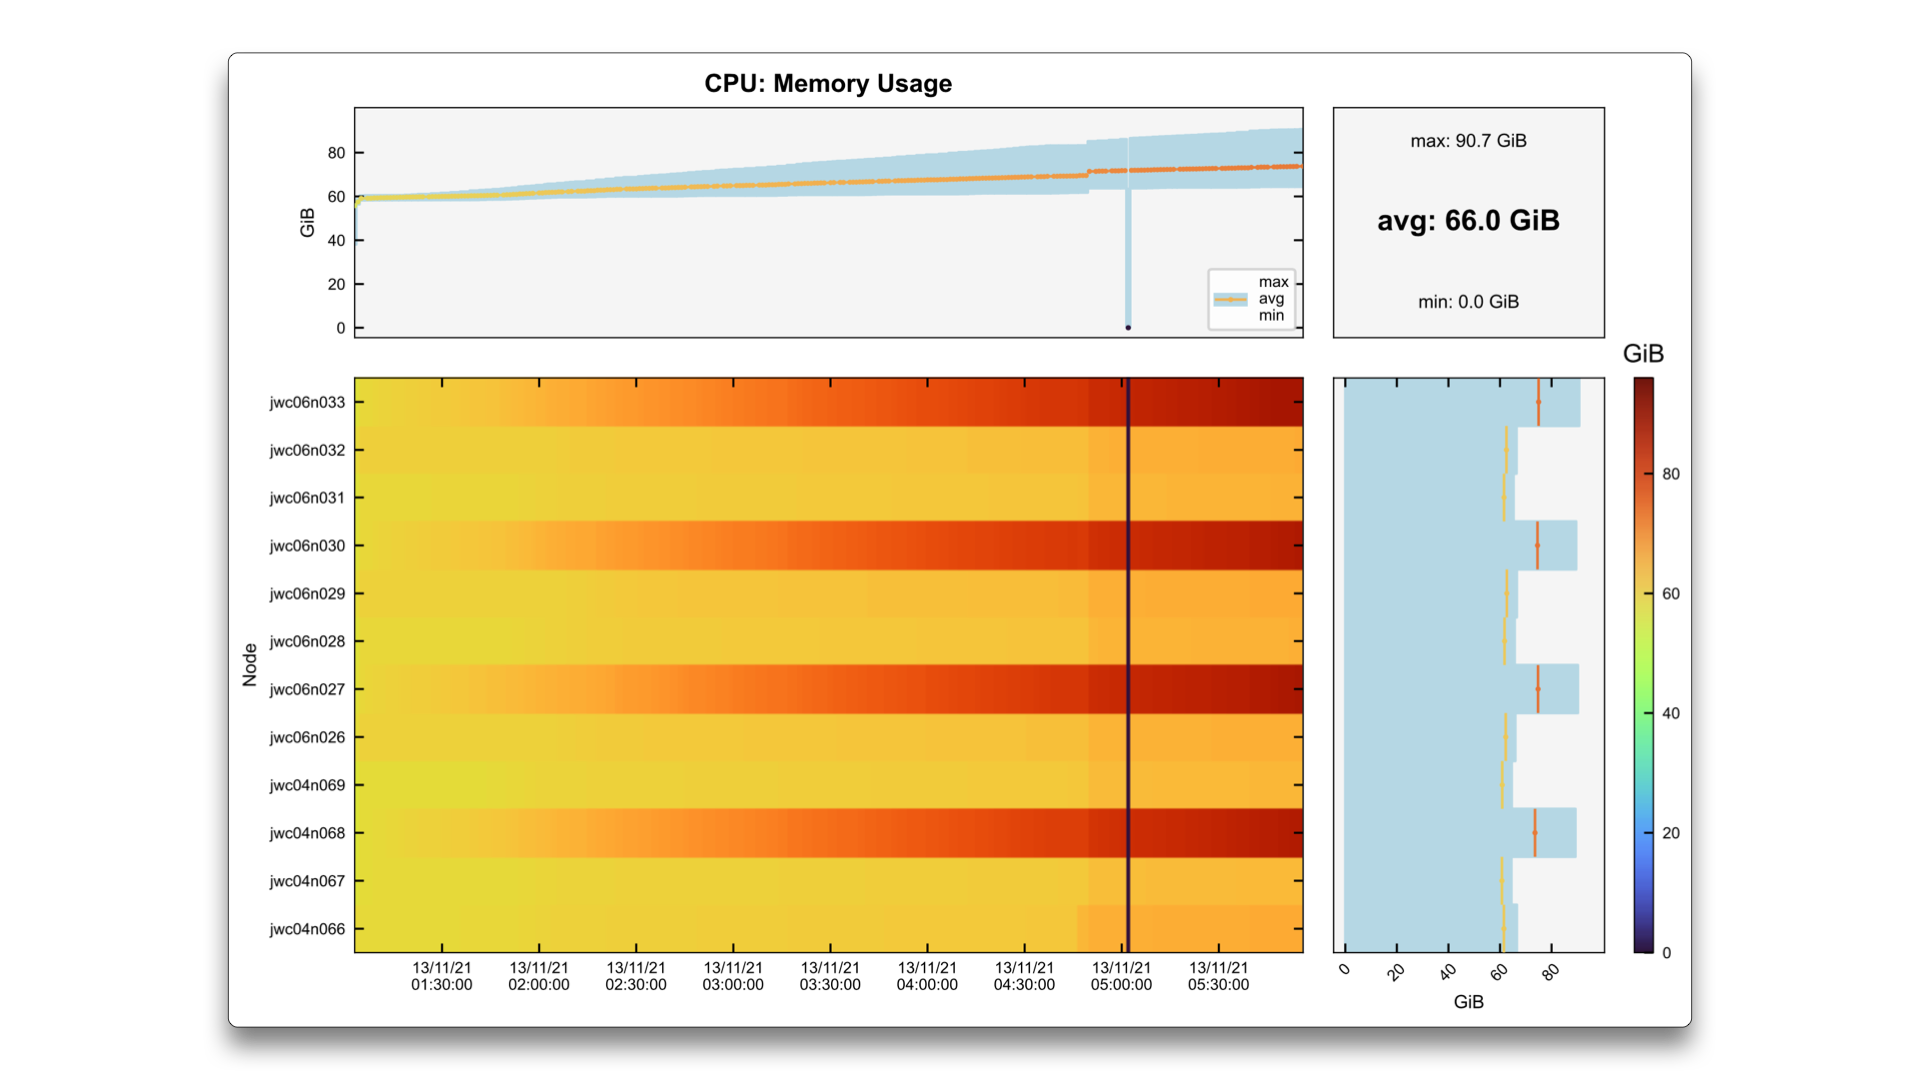
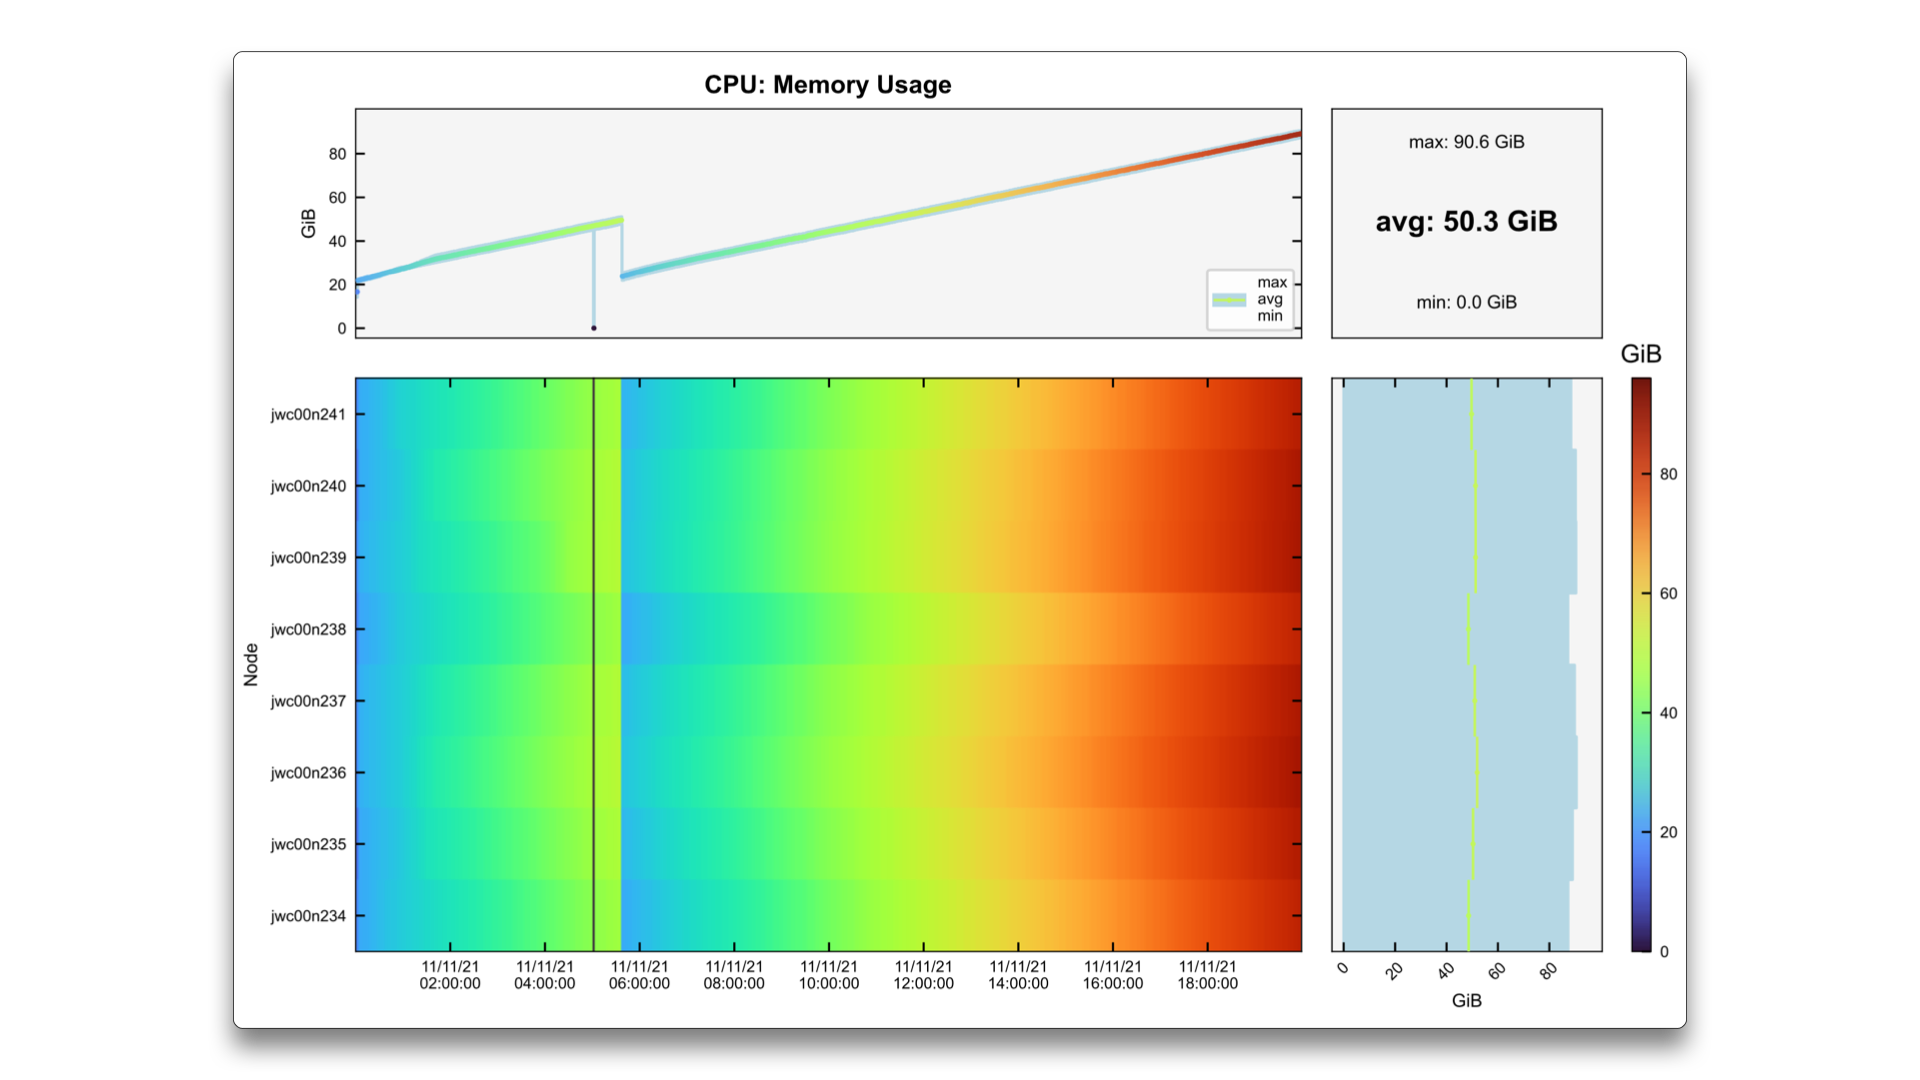
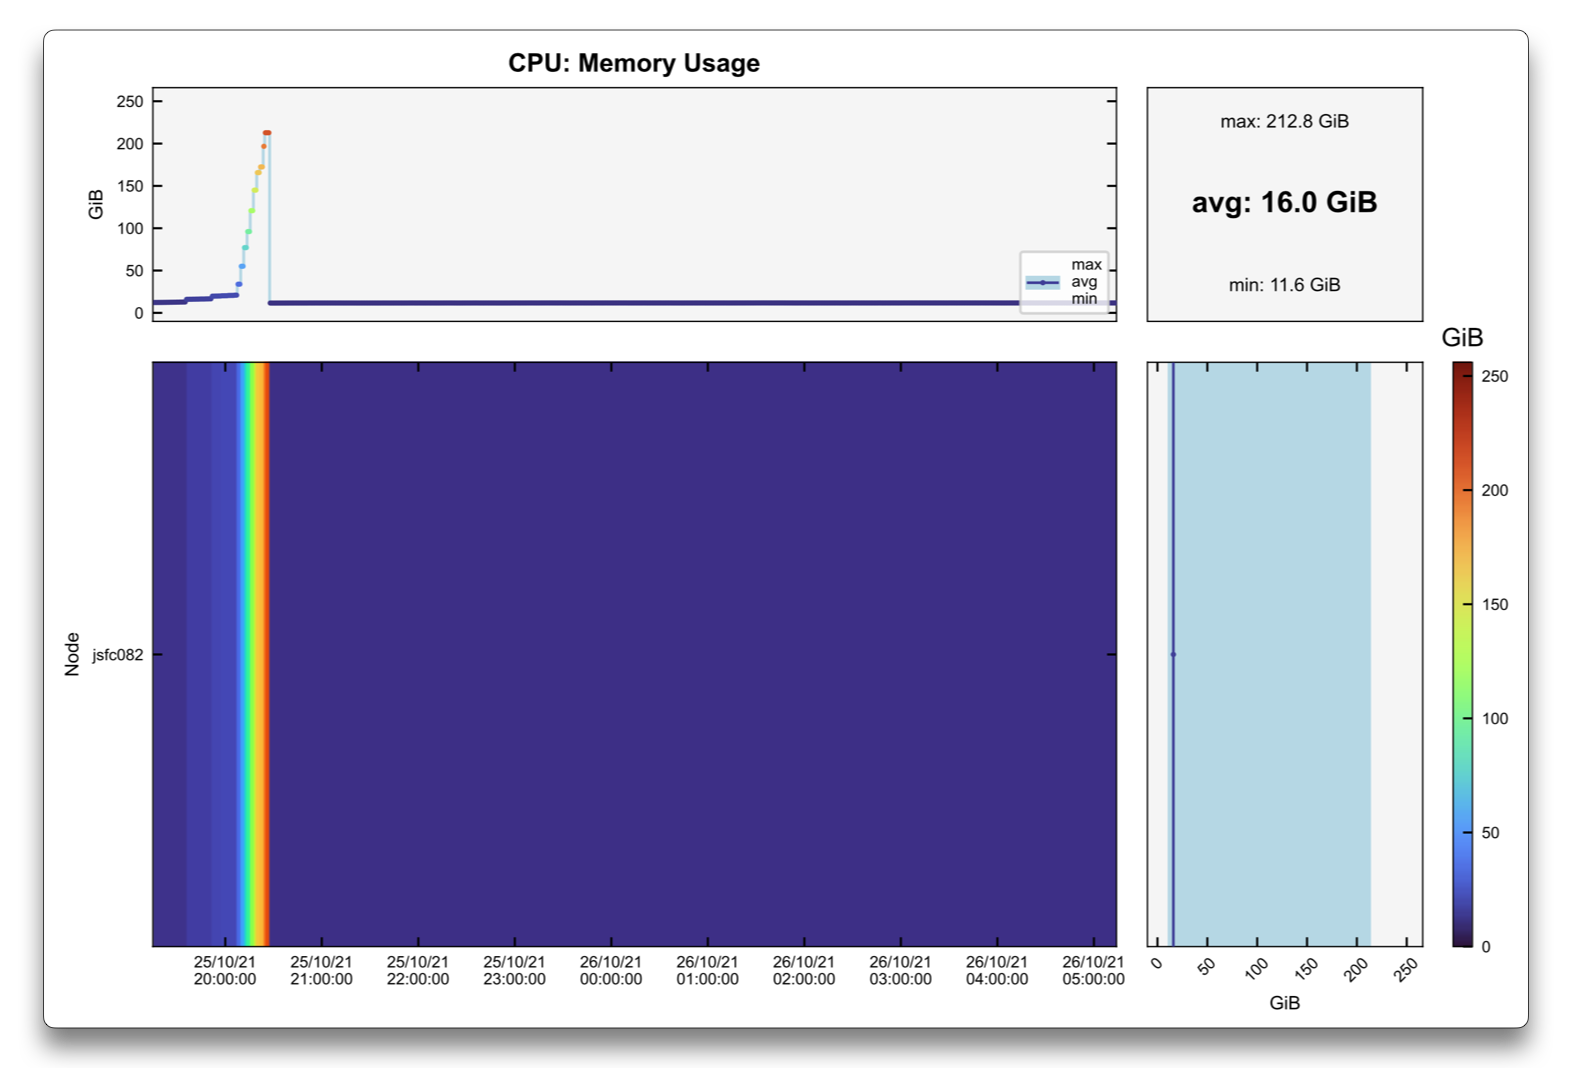
The example above is a typical case where the memory usage increases constantly until it reaches the
maximum amount available on the node (in this case, around 85 GiB). This may be the correct behaviour
of the code, if it needs to keep storing more and more information as it is produced, but it may worth a
check if there is something that may be deallocated or even some other algorithm.
Note
In LLview job reports, the memory usage graphs (both for CPU and GPU) is scaled by default from 0 up to the memory limit of the device. In the interactive graphs, these limits can be changed for the job limits.
In this second scenario, the job uses 12 nodes, and only every third node display a monotonic memory increase. In the top graph, which is the node-averaged memory usage per time, the average line may not be too high, but the maximum reaches the limit of the system, and the program crashes. As before, this can be a case of unfreed memory on those particular nodes.
This third case shows an example of a job that consists of two parts. At the end of the first one, some memory is freed, and the memory usage decreases. However, in the second part it increases again, reaching the limit of the system.
Unused GPUs
The supercomputers usually have a number of GPUs in each node (at JSC, there are 4 GPUs per node).
Their usage may be requested via the SBATCH argument --gres=gpu:X of Slurm,
and then they must be correctly used by the code.
Another common scenario is that the code requests a given amount of nodes, but does not use
all the GPUs that are available.

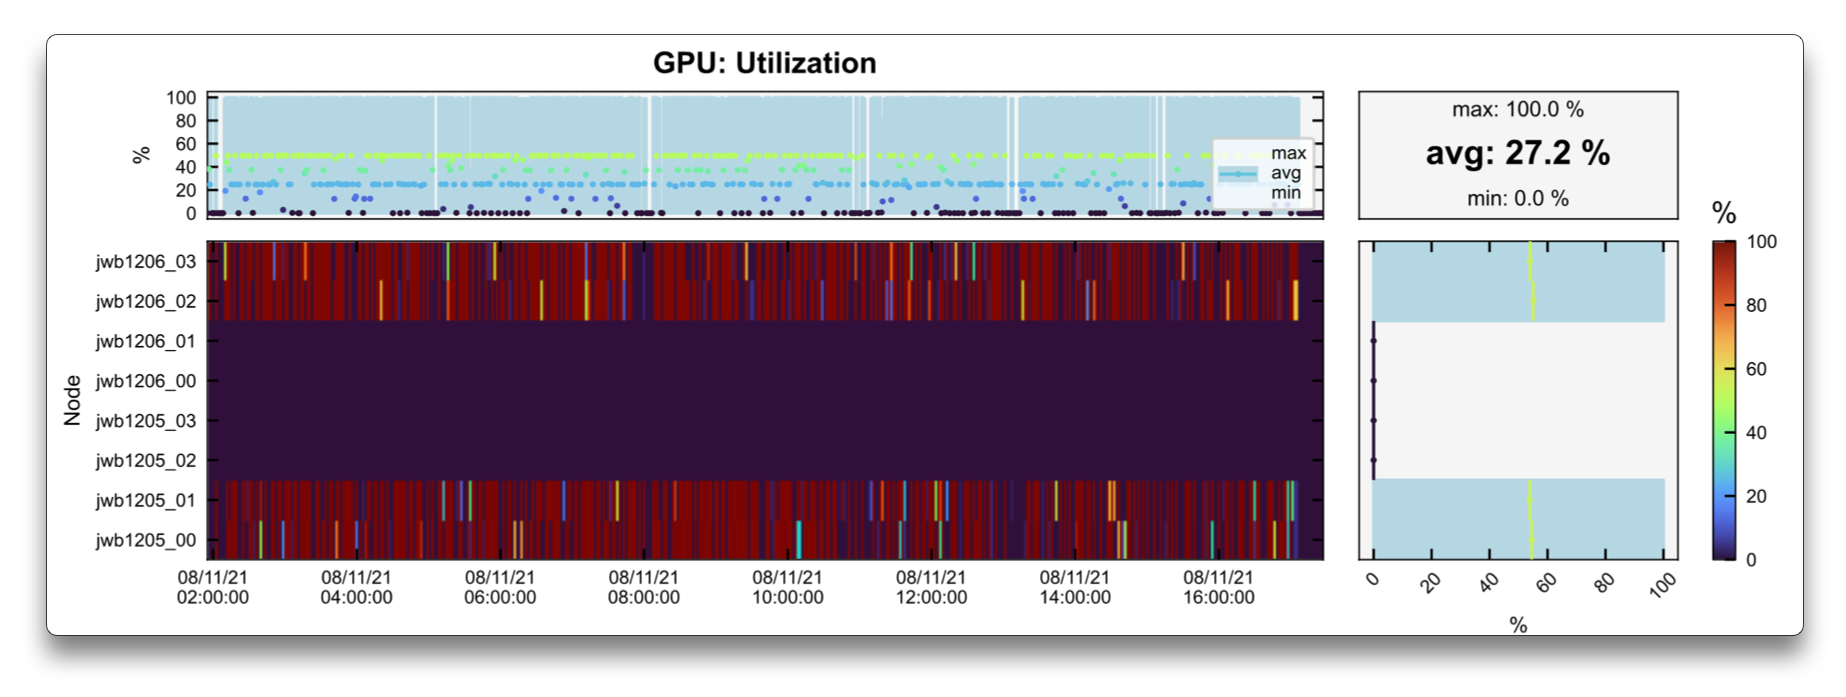
This can be clearly seen in the GPU Utilization graph shown above, where the code is using only 1 GPU per node, and therefore taking longer to finish running and wasting computing time (as the job could have run in 4 times less nodes).
Another example of unused GPUs is shown in a smaller job above. In this case, 2 nodes were requested, but only the first two GPU of the first node and last two GPU of the second node were being used-while 4 GPUs were budy, another 4 were idle. After the error has been identified via its job report on LLview, the user was informed and fixed the issue.
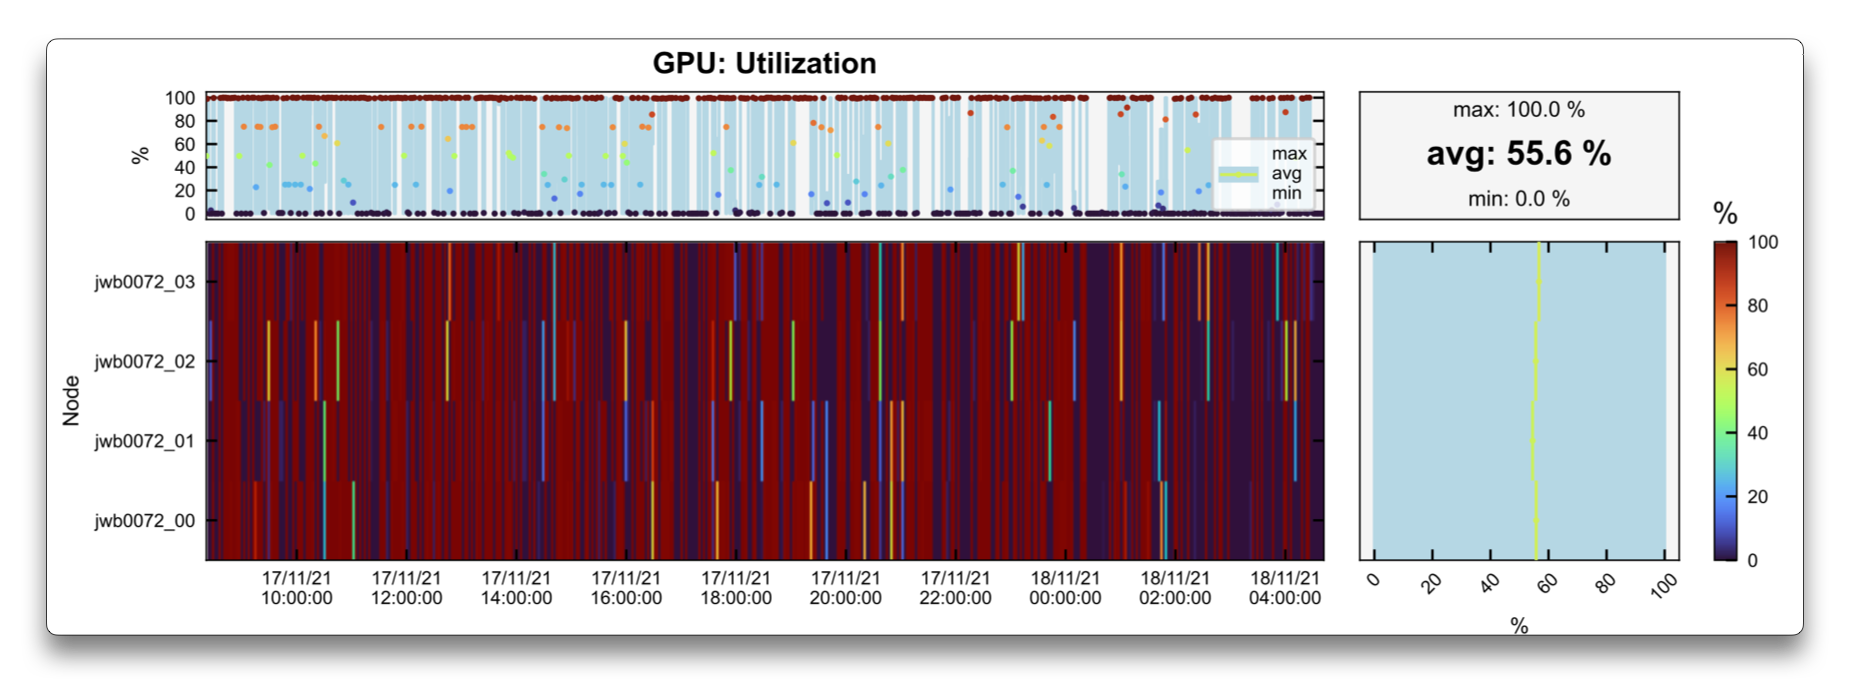
The new reports confirm that the new job use a single node, with all the GPUs being utilized.
High Temperature / GPU Throttling
GPUs are expected to work on a given frequency.
However, it may happen that due to different reasons, the working frequency is decreased-which is called throttling.
The most recurring cause of throttling is when the GPU operates at a high temperature (which by itself can also have different causes).
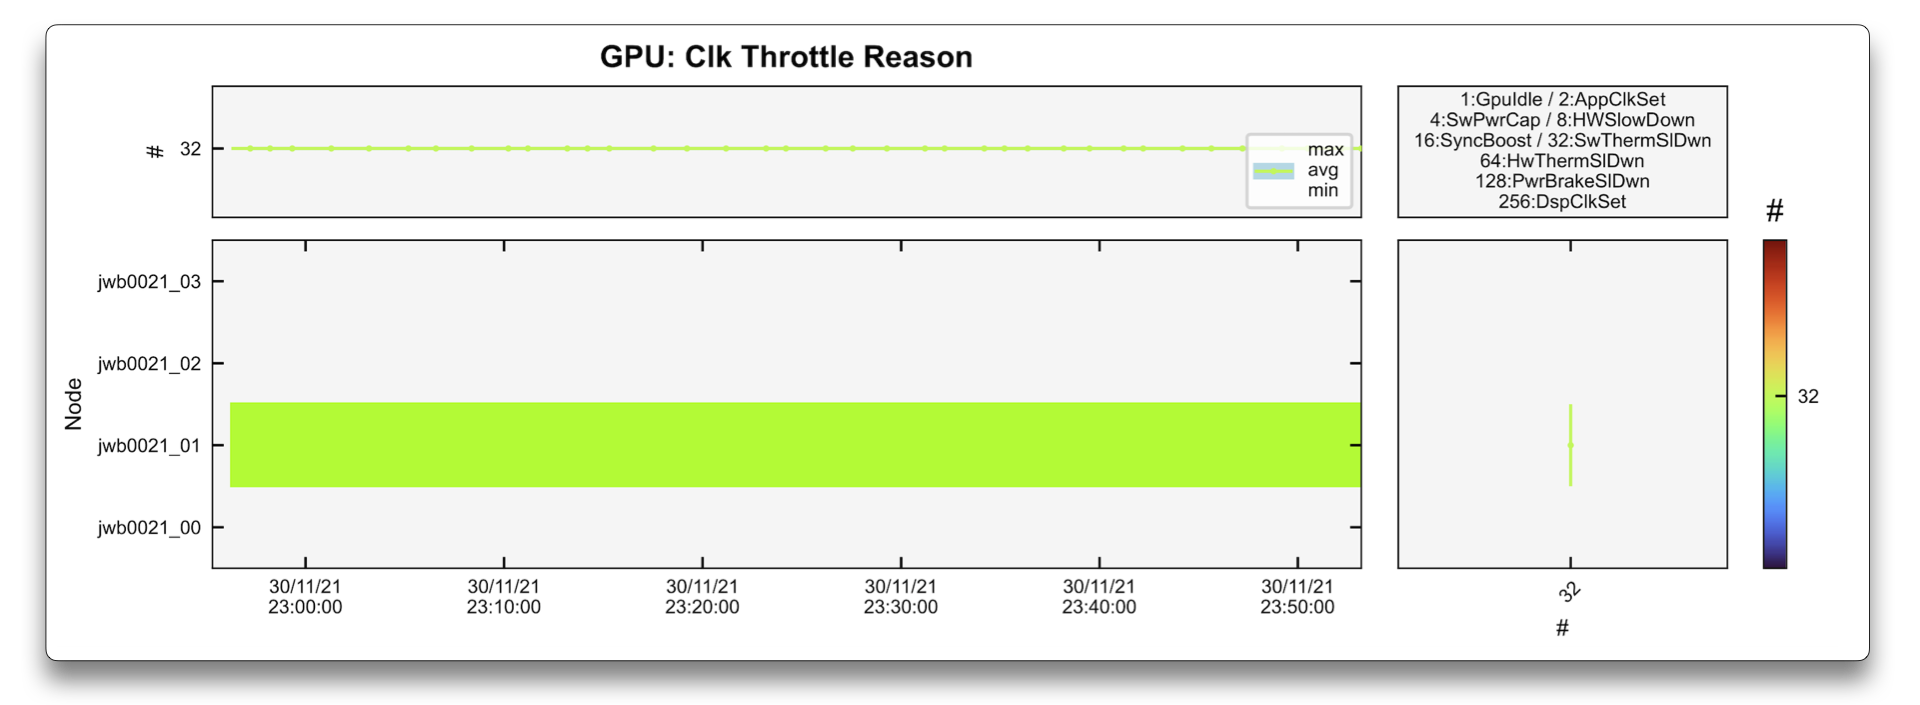
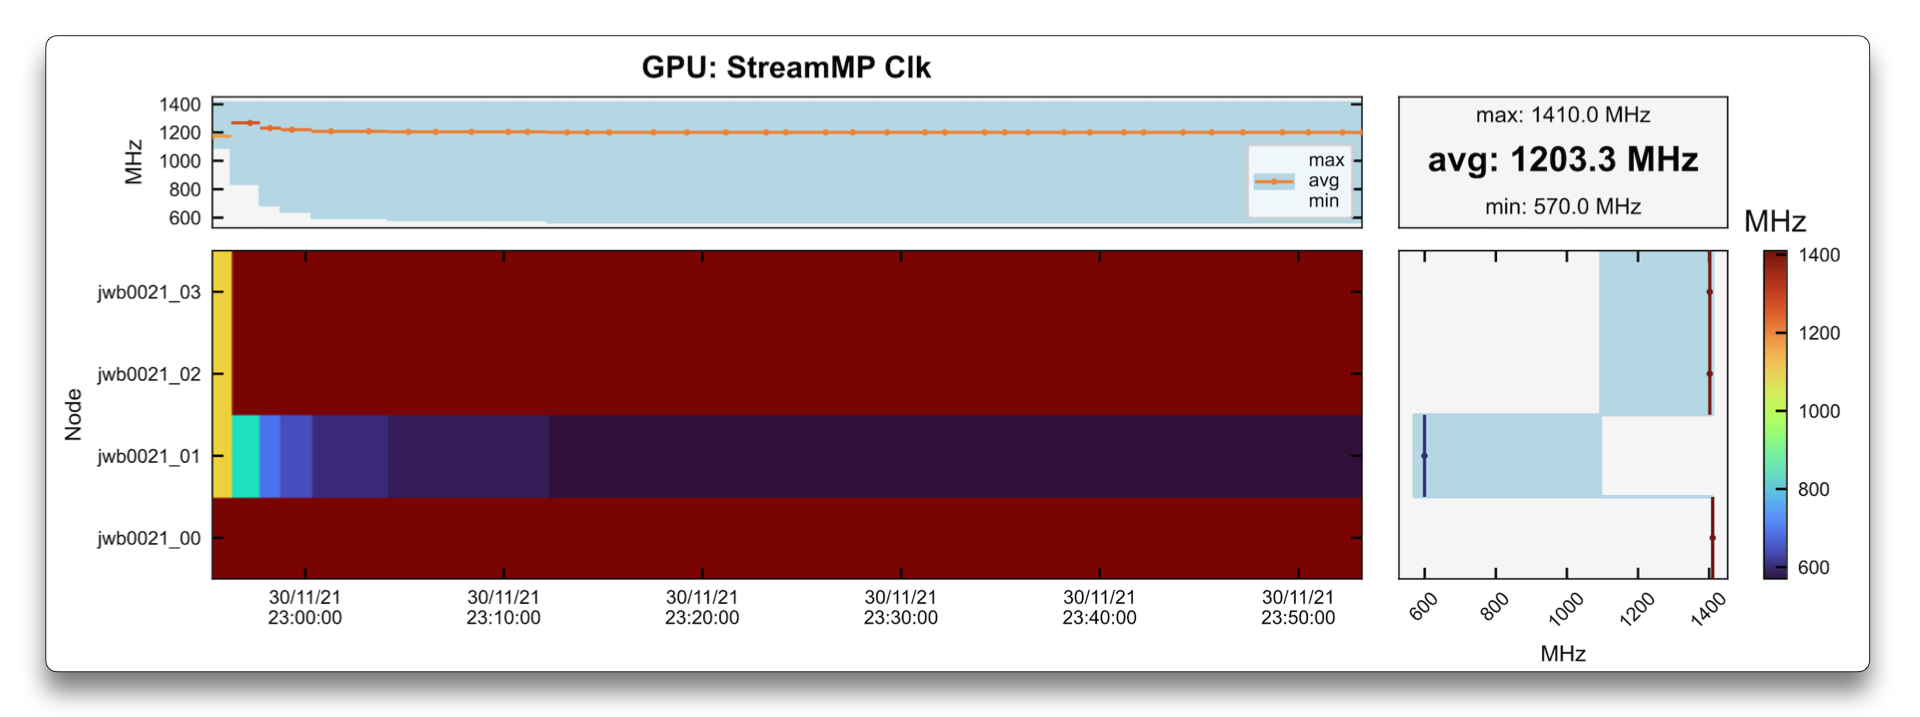
The graphs above show how this issue can be identified.
In this case, a single node job used 4 GPUs, and one of them had much slower frequency (as seen in the StreamMP Clk plot) than the others.
The cause of this speed down can be identified in the Clock Throttle Reason graph as being 32:SwThermSlDwn (Software Thermal Slowdown).
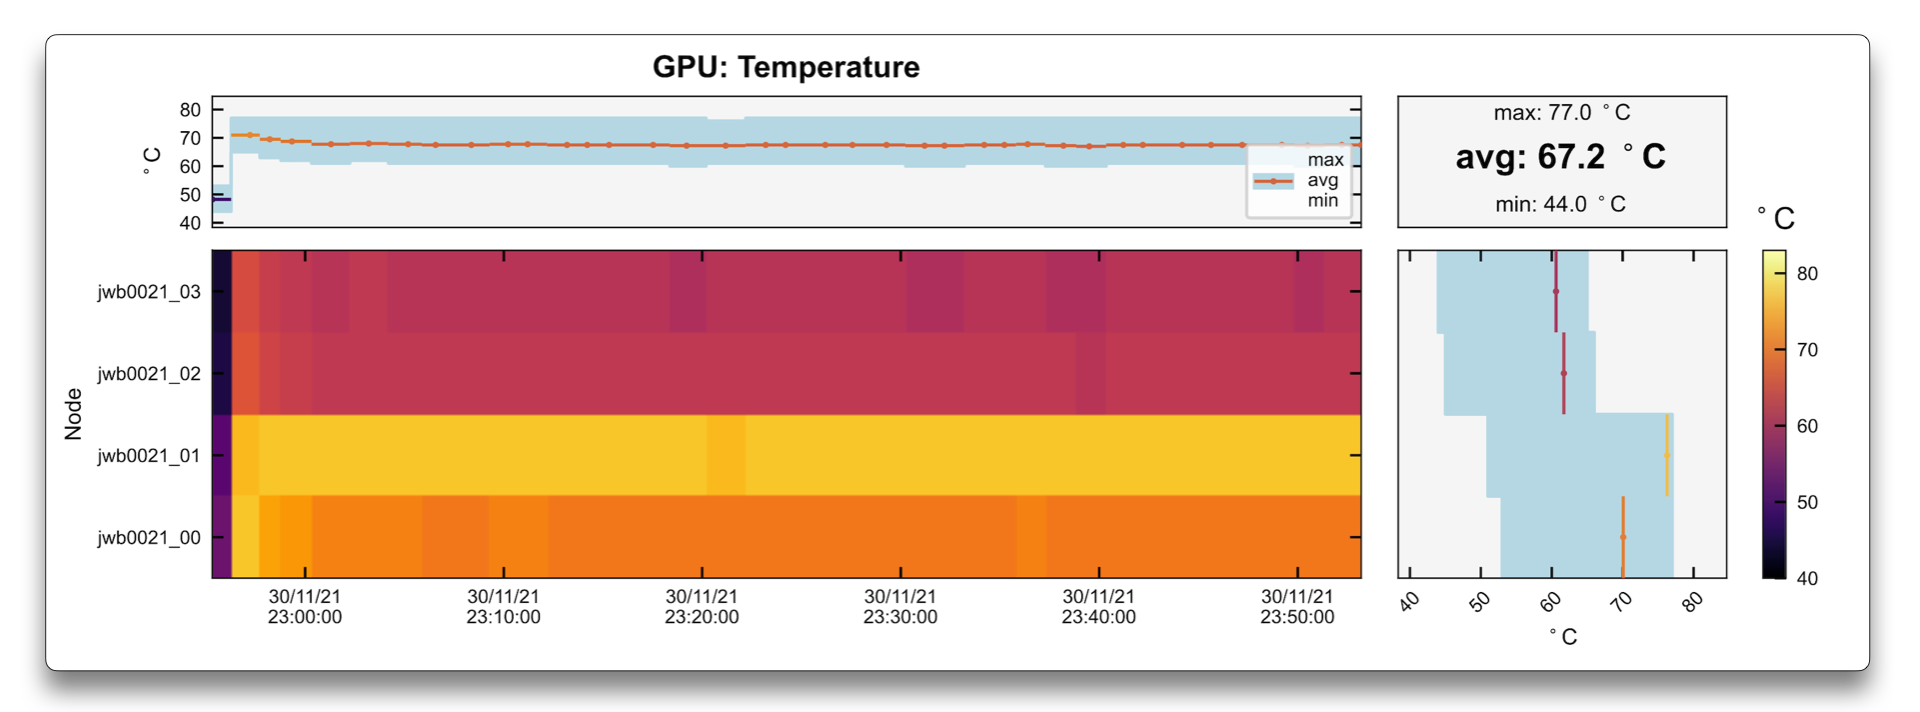
Finally, the temperature of that given GPU was 77°C, which was not large enough to trigger error signals to the administrators,
but after being warned by the user, the referred node was put in maintenance to be fixed.
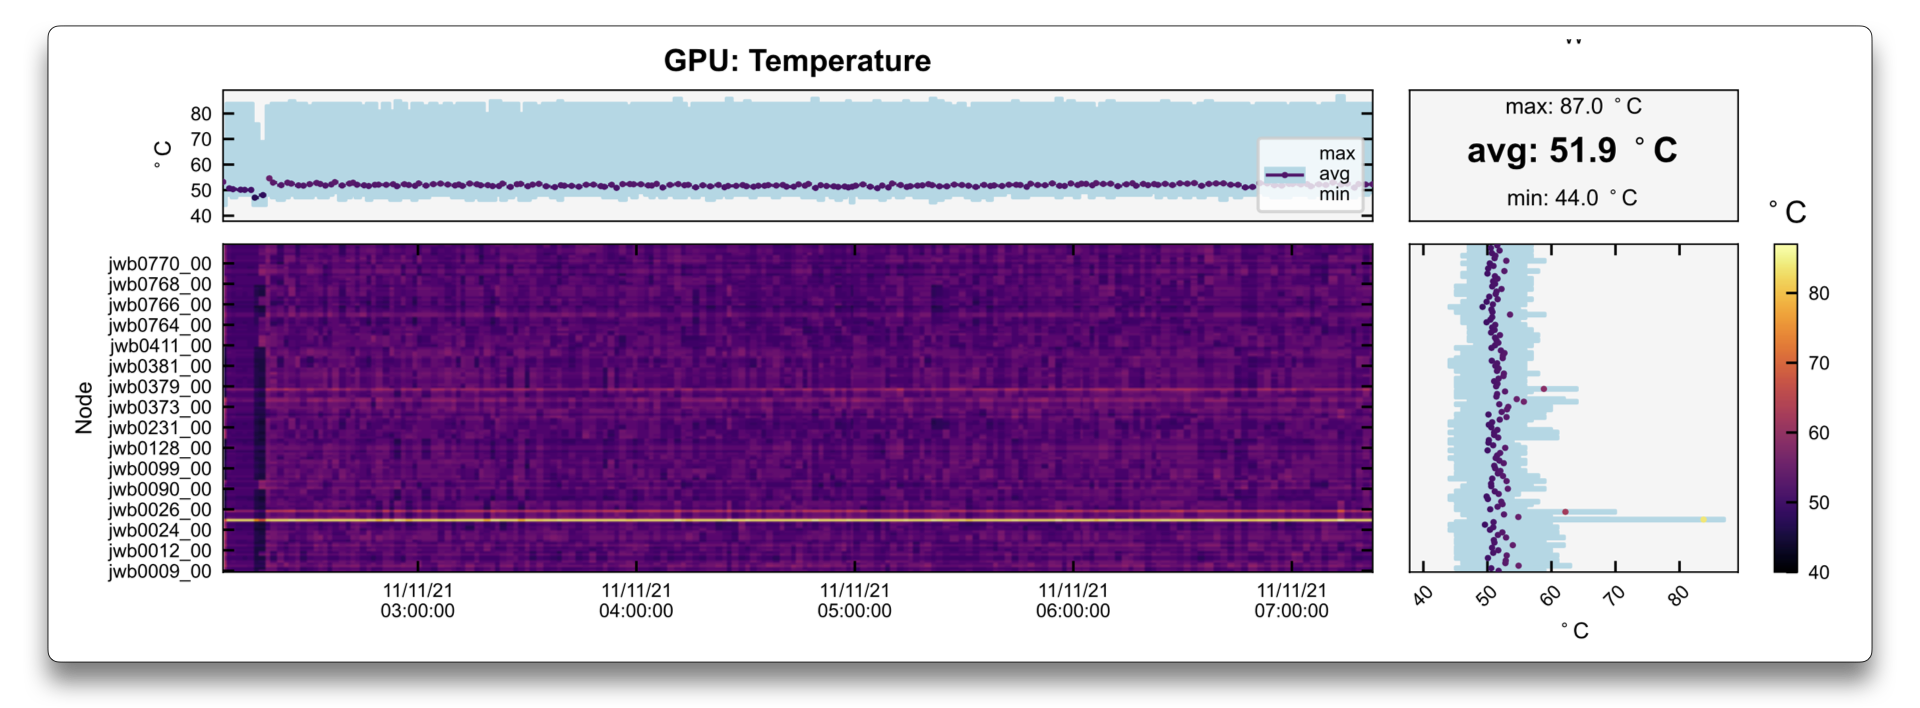
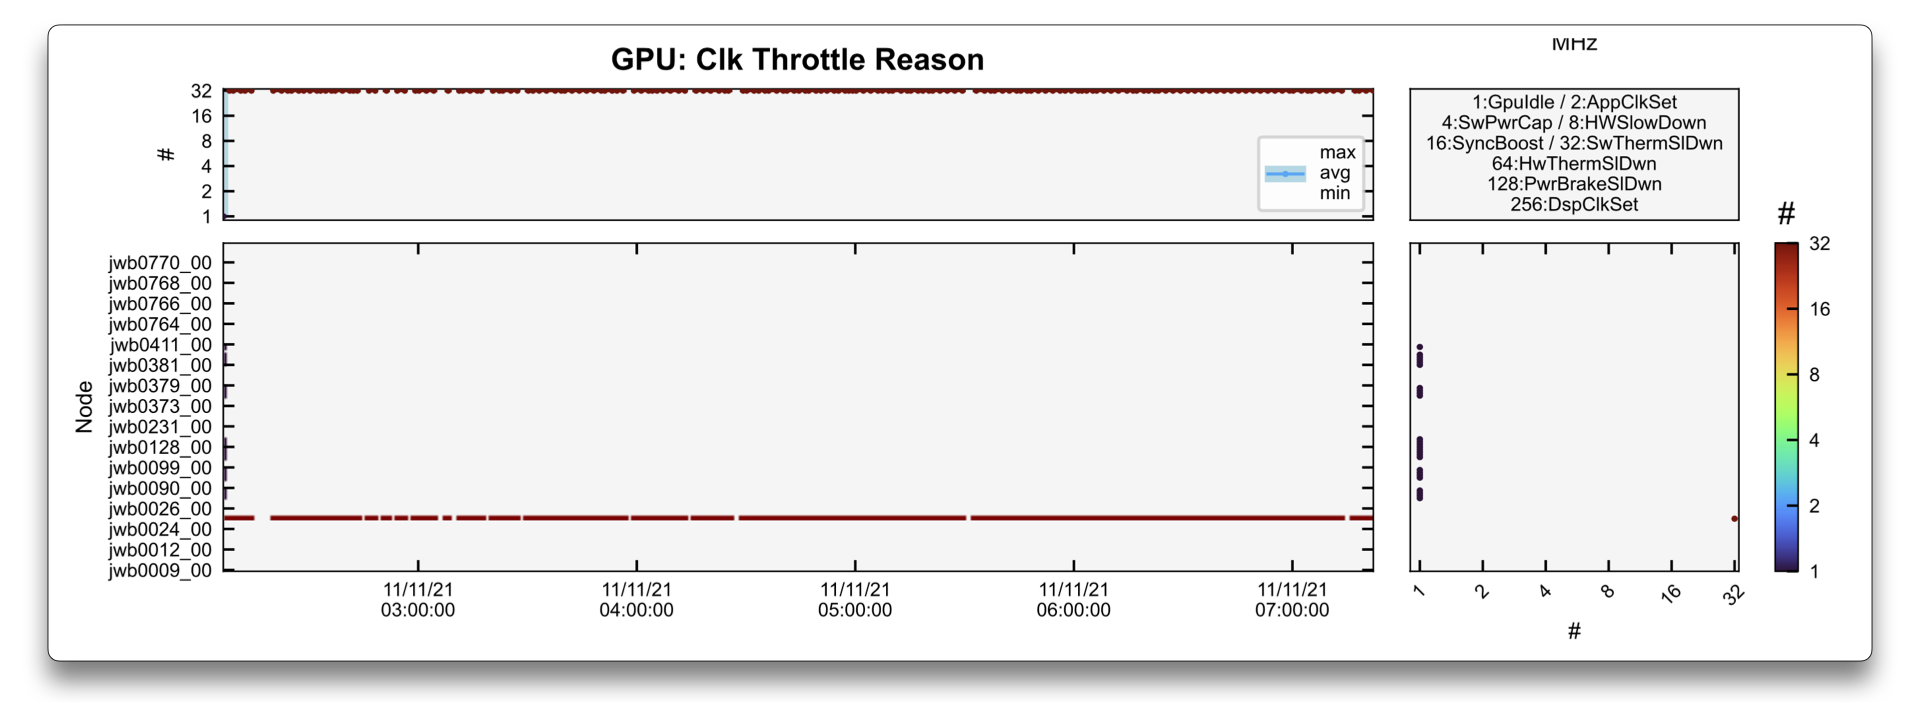

In this second example, it is more obvious that a single GPU in a very large job is much hotter than the others.
This also causes a clock throttle (i.e., a frequency decrease) of that given GPU in the StreamMP Clk due
to 32:SwThermSlDwn (Software Thermal Slowdown).
The node containing this GPU was drained and repaired.
GPUs used with low occupation
When you first inspect GPU performance, you might check GPU Utilization.
This shows the percentage of time—over the last sampling interval—during which any kernel was running on the GPU.
But beware: a single, simple kernel running constantly will report 100 % Utilization, even if it only uses a tiny slice of the GPU's actual compute resources.
A more telling metric for real parallelism is GPU Active SM.
This measures the average fraction of time that at least one warp was active on each Streaming Multiprocessor (SM), then averages across all SMs.
(For reference, an NVIDIA A100 has 108 SMs, and an H100 may have up to 132 SMs.)

In the chart above, the job drives the GPU continuously (so Utilization reads 100 %) yet SM occupancy remains low. That gap means many SMs sit idle—if you launch more work or larger kernels, you can improve occupancy and make your code run significantly faster.
Load imbalance
Another example where the LLview job reports may be of use is to verify poor performance of the code. This can have origins on a wrong setup (as shown in Unused GPUs) or system problems (due to e.g., High Temperature / GPU Throttling). However, it can also happen due to load imbalance in the code, that is, when some nodes have to do more work than others.
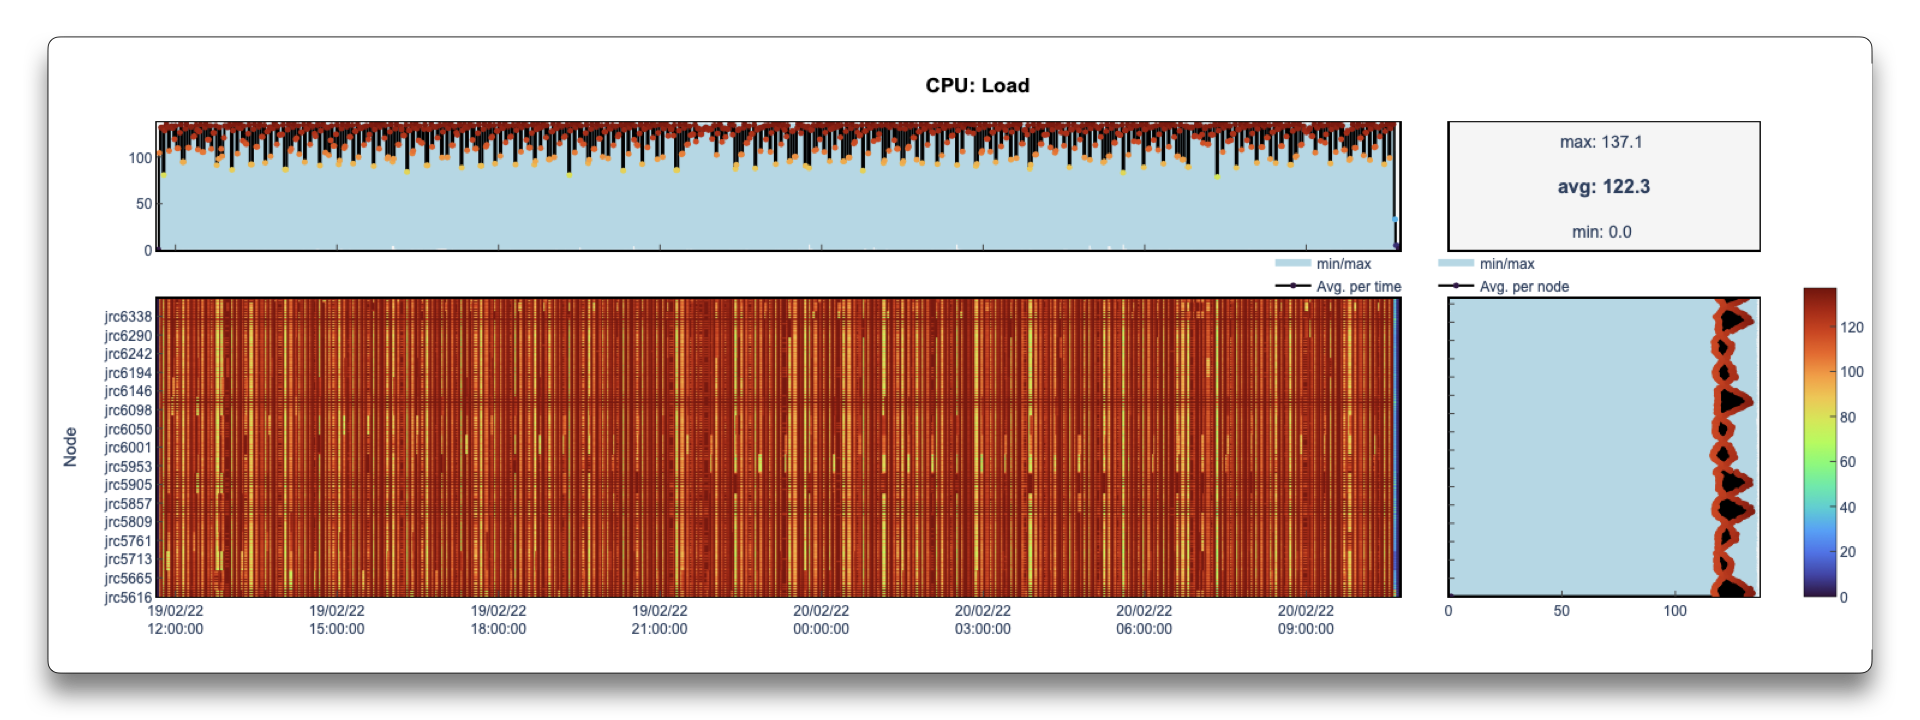
In the case above, this is reflected on a CPU load that varies between the nodes.
Note
In LLview job reports, the CPU Load is obtained from Slurm, which at JSC contains the 1-min load average.
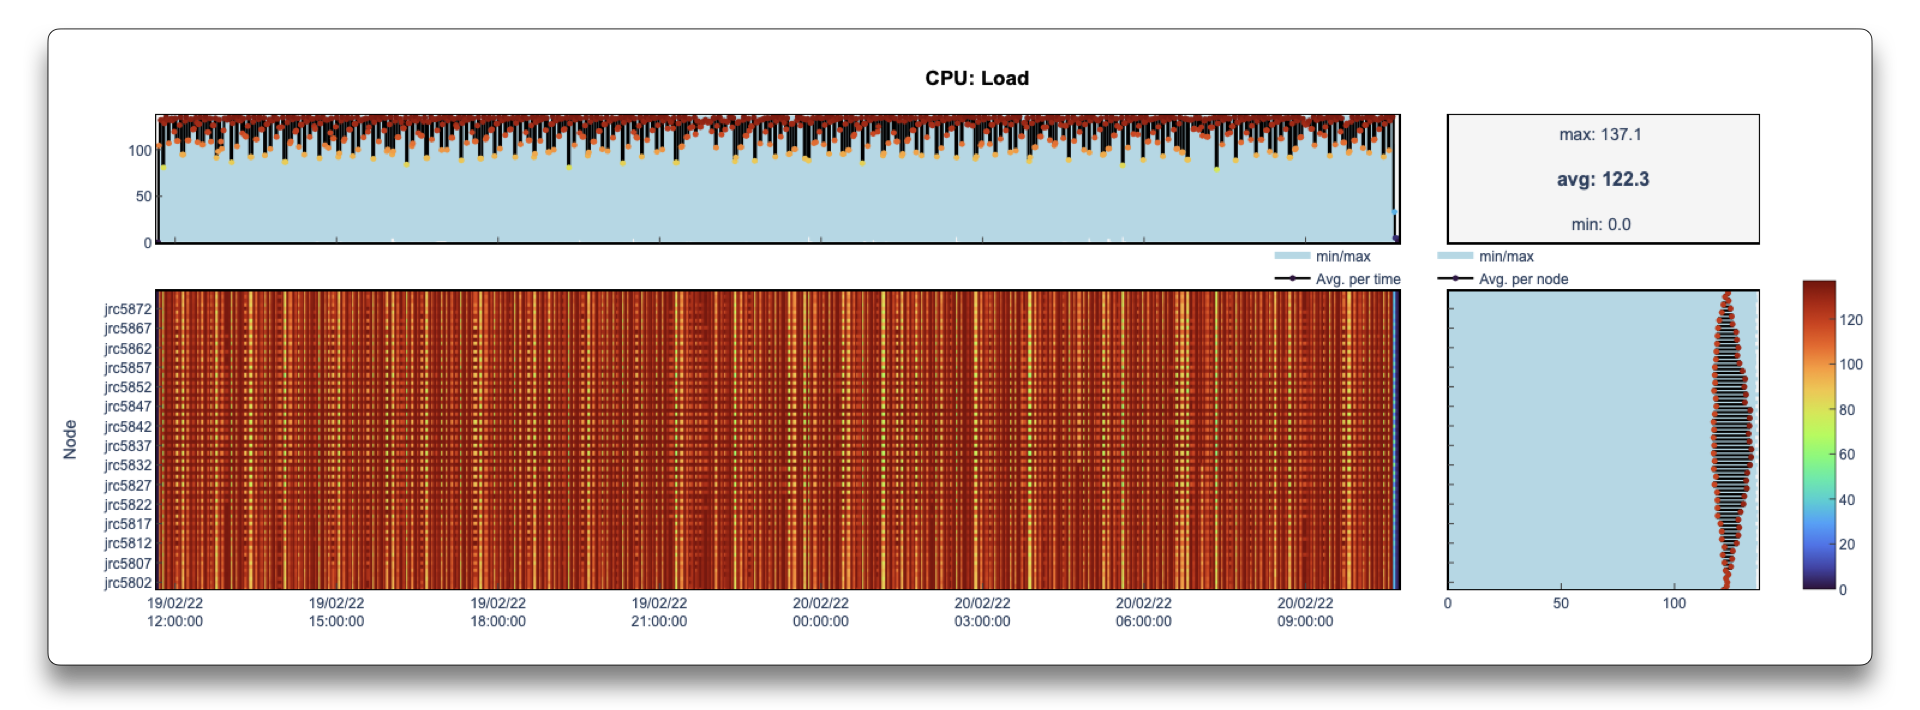
When zooming a particular region (which can be done in the detailed reports generated by LLview), the pattern becomes more clear. In this case, the origin was a bad choice of distribution scheduling in OpenMP.
CPU-GPU load alternation
Besides helping to identify errors or erroneous configurations, the reports may also help to recognize patterns on the jobs.

The overview of the job above shows how the workload alternates between CPU and GPU, and where the time is mostly spent. This information can be used to focus performance improvements either on the most time-consuming part or on overlapping calculations, if possible.
Others
This just looks like a rainbow in a blue sky. If you have a nice graph send to us too!
Have a nice day!