Detailed Reports
Each detailed report is organised into the following sections:
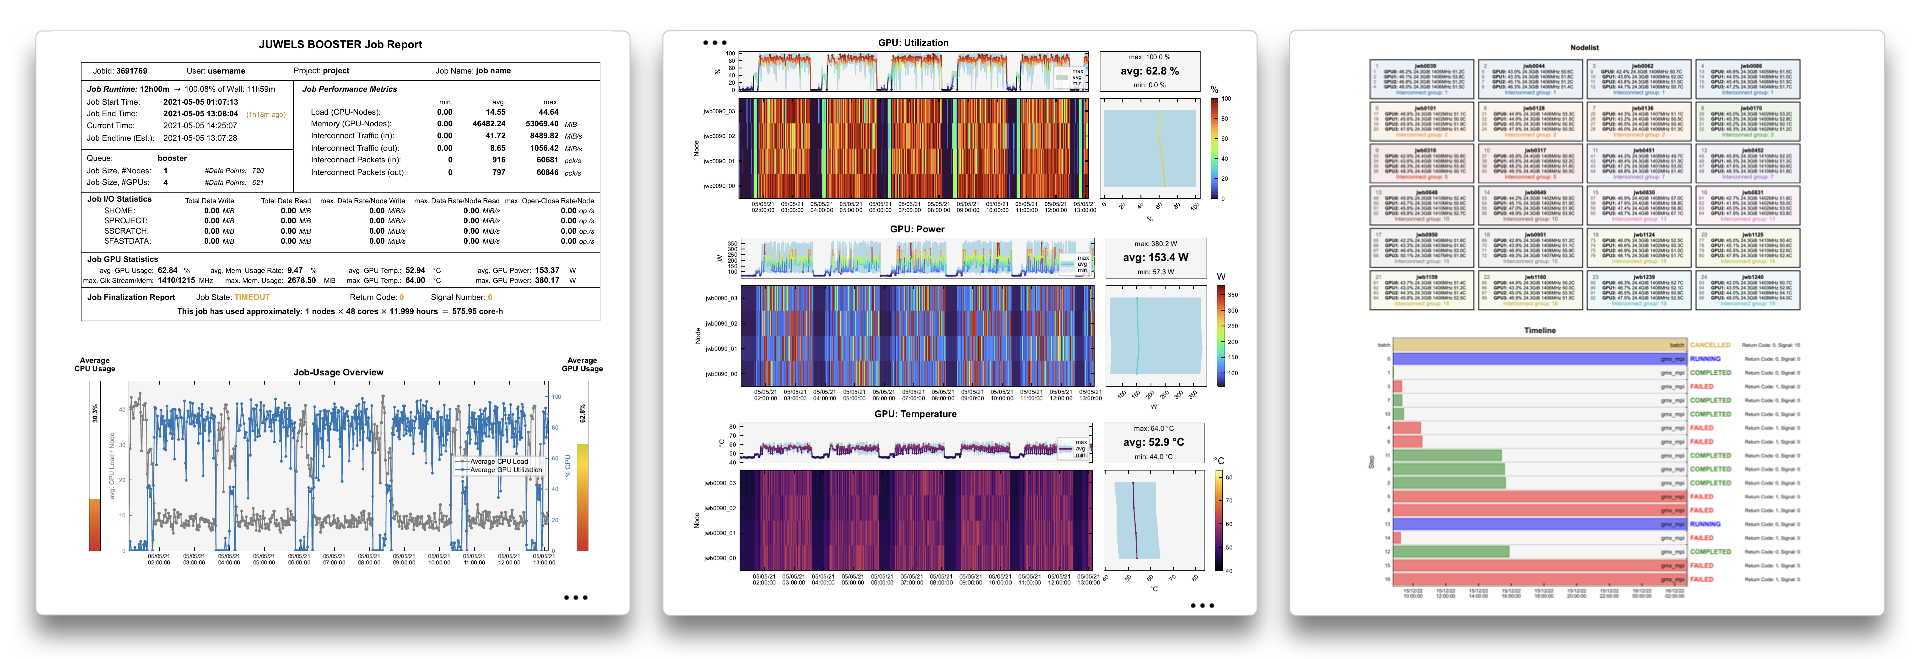
- Overview Table
A concise snapshot of job metadata, timing, resources, performance summaries, I/O stats, GPU metrics, and final status. - Usage Overview Graph
Time-series trends and overall averages for CPU and GPU utilisation. - Metric Graphs
Interactive heatmaps of individual metrics over time or across resources. For a complete list of metrics, see the List of metrics. For additional graph examples, visit Examples. - Node List
Allocated nodes coloured by interconnect group, with GPU details and error highlights. - Timeline
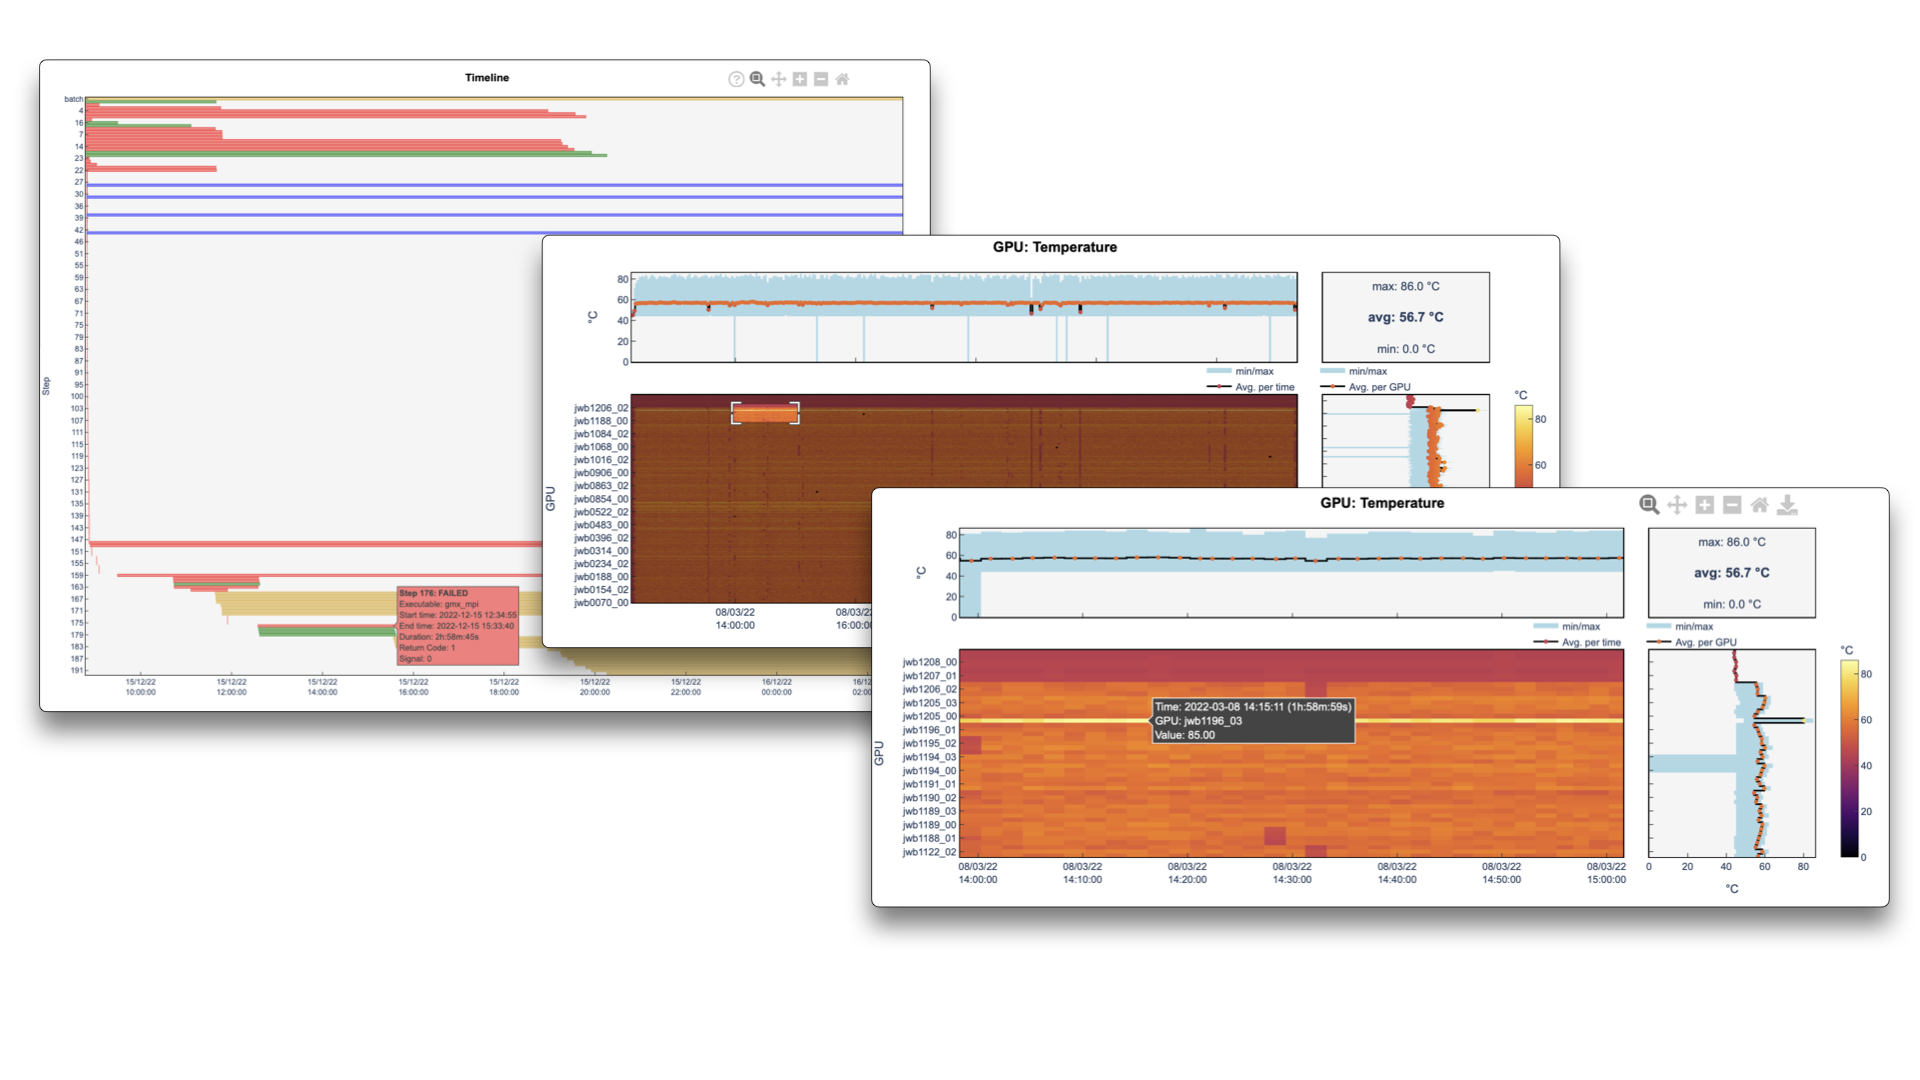
Chronological bars showing job and step durations coloured by state (interactive details on hover and click). - System Errors
Infrastructure-level errors detected during the run (this section appears only when system errors occur).
Tip
The job reports accept options using the Slurm --comment field. Currently, the option below is available:
llview_plot_lines: In the PDF report, use line plots for each node/GPU instead of colorplots (recommended for jobs on fewer than 16 nodes or GPUs).
Info
In the web-based report (accessible via the link):
- Hover over data points to see exact values.
- Click-and-drag or pan to zoom and shift axes.
- Zoom-lock toggle on the info bar (at the bottom) to synchronise axis ranges across sections.
- Download graph data as JSON using the button in the top-right corner of each chart.