|
Cube GUI User Guide
(CubeGUI 4.8.2, revision 7895e762)
Introduction in Cube GUI and its usage
|
|
Cube GUI User Guide
(CubeGUI 4.8.2, revision 7895e762)
Introduction in Cube GUI and its usage
|

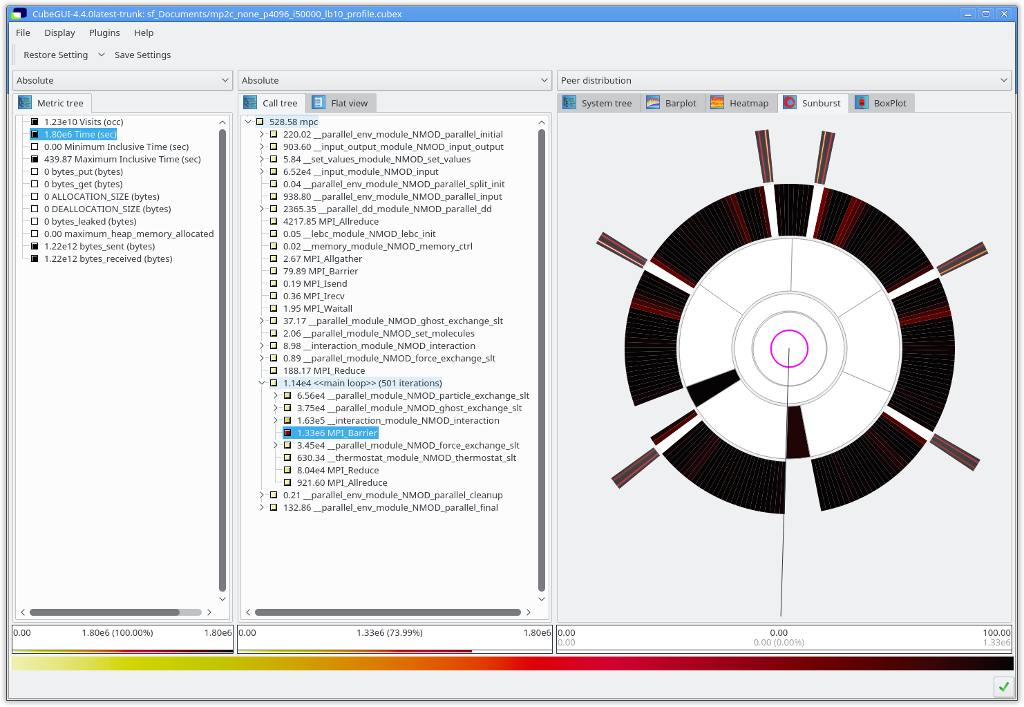
This plugin adds a sunburst chart display tab to the system pane. The sunburst chart uses a radial tree to visualize the system-tree in a more compact form than the system-tree.
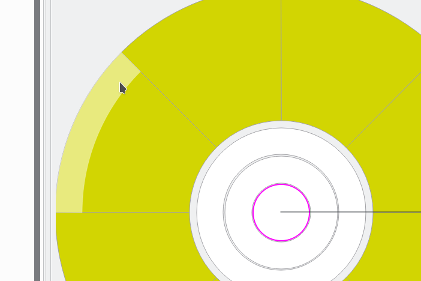
The sunburst chart and the system-tree are coupled, allowing the user to expand and collapse tree nodes in either widget with the changed state showing in the other widget. The arcs of the sunburst chart can be expanded and collapsed by <left-mouse click> on the outer edge of the arc. The edge is highlighted as shown in Figure sbedge when hovering over it with the mouse cursor.

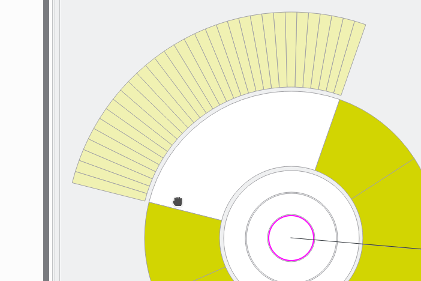
When expanded, the accumulated width of the child arcs is bounded by the width of their parent arc. To adjust the width of an arc, the user can expand its area by using Ctrl+<left-mouse drag> while clicking close to the side edge of the respective arc, as shown in Figure sbwidth. The width of sibling arcs is adjusted automatically.

The standard interaction, next to expanding and collapsing arcs, is to rotate the sunburst chart, which is done via simple <left-mouse drag>. The user can zoom into and out of parts of the sunburst chart using the mouse wheel. The zoom behavior can be customized using the context menu. Furthermore, the user can move the visible canvas width Shift+<left-mouse drag>.
The user experience can be customized through flags set in the context menu via <right-mouse click>. Furthermore, the context menu allows to reset specific or all interactions (e.g., rotation, arc width) with the chart to their default value.
The following table lists all available mouse interactions:
| <left-mouse click> | On arc:Select arc On arc edge:Expand/collapse arc |
| <right-mouse click> | Context menu |
| <left-mouse drag> | Rotate chart |
| Ctrl+<left-mouse drag> | Change arc width |
| Shift+<left-mouse drag> | Move chart on canvas |
| < scroll mouse-wheel > | Zoom in/out |
The following table lists all setting available via context menu:
| Frame coloring | Adjust the frame color of arcs |
| Selection coloring | Adjust the frame color of selected arcs |
| Mark 0 degrees | Draw a line where the widget start the fan of arcs |
| Hide info tooltip | Do not show arc info in top left corner when hovering over a arc |
| Hide frame of small arcs | Avoid visual clutter by not drawing frames around thin arcshal |
| Zoom towards the cursor | Instead of zooming into the chart origin, zoom towards the cursor |
| Invert zoom | Invert zoom direction when using the mouse wheel of track pad |
| Reset | Reset selected or all interactions (e.g., arc width, rotation,...) to default state |
 |
Copyright © 1998–2022 Forschungszentrum Jülich GmbH,
Jülich Supercomputing Centre
Copyright © 2009–2015 German Research School for Simulation Sciences GmbH, Laboratory for Parallel Programming |