Cube GUI User Guide  (CubeGUI 4.8.2, revision 7895e762)
Introduction in Cube GUI and its usage
Advanced Color Map Plugin

Advanced Color Map Plugin provides additional color maps. The configuration dialogs are presented in Figure coloring_acm. For every color map, the plot allows for change of data accepted by color map and one can do that using left and right marker, by dragging the marker or providing exact position through a double click near the marker value (new dialog will appear). The default color for values out of range is grey.
One can change colors of scheme (for some color maps) and color for values out of range. Double mouse click on proper part of the plot opens a dialog with selection of RGB color. Additionally, one can adjust the plot marker or reset to default values through the context menu.
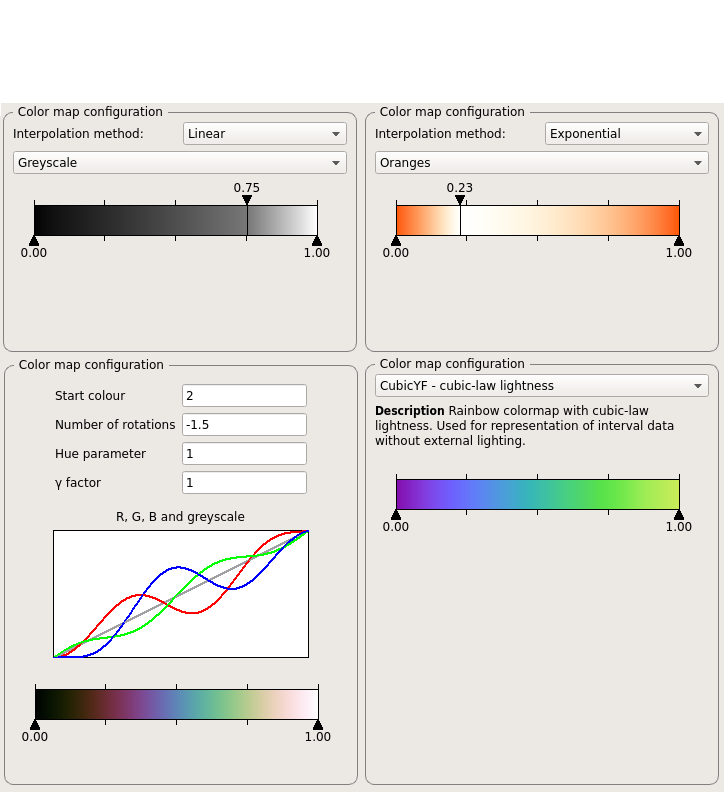
acm_collage.png
"coloring_acm": The examples of configuration for Advanced Color Maps. Upper row, starting from left: sequential, divergent; lower row, starting from left: cubehelix, improved rainbow.

Currently the plugin adds four different sets of color maps:

  1. Sequential: Scheme is defined by starting and ending color with linear or exponential interpolation between them. Predefined schemes provide simple interpolation from one color to pure white. Middle marker allows for subtle change of interpolation.

  2. Divergent: This scheme is defined by an interpolation from starting to ending color, but with a critical value between them, depicted with the pure white. The position of critical point can be set with the middle marker.
  3. Cubehelix: Scheme designed primarily for display of astronomical intensity images. The coloring is based on distribution from black to white, with R, G and B helixes giving additional deviations. Cubehelix is defined by four parameters:
    Start colour - starting value for color, floating-point number between 0.0 and 3.0. R = 1, G = 2, B = 0
    Rotations - floating-point number of R -> G -> B rotations from the start to the end. Negative value corresponds to negative direction of rotation.
    Hue - non-negative value which controls saturation of the scheme, with pure greyscale for hue equal to 0.
    Gamma factor - non-negative value which configures intensity of colours. Values below one emphasizes low intensity values and creates brighter color scheme. Values above one emphasizes high intensity values and generates darker color map.
    Reference: Green, D. A., 2011, `A colour scheme for the display of astronomical intensity images', Bulletin of the Astronomical Society of India, 39, 289.
  4. Improved rainbow colormap: Set of color maps based on original jet (rainbow) scheme, but with different lightness distribution. The goal behind these schemes is to provide map with more balanced perception, which is poor for original jet, mainly because of sharp changes in lightness. These maps doesn't provide any possibility for configuration.
    Reference: Perceptually improved colormaps, MATLAB Central

Cube Writer Library    Copyright © 1998–2022 Forschungszentrum Jülich GmbH, Jülich Supercomputing Centre
Copyright © 2009–2015 German Research School for Simulation Sciences GmbH, Laboratory for Parallel Programming