 |
Cube GUI User Guide
(CubeGUI 4.4.4, revision 18494)
Introduction in Cube GUI and its usage
|
|
Cube GUI User Guide
(CubeGUI 4.4.4, revision 18494)
Introduction in Cube GUI and its usage
|
In many parallel applications, each process (or thread) communicates only with a limited number of processes. The parallel algorithm divides the application domain into smaller chunks known as sub-domains. A process usually communicates with processes owning sub-domains adjacent to its own. The mapping of data onto processes and the neighborhood relationship resulting from this mapping is called virtual topology. Many applications use one or more virtual topologies specified as multi-dimensional Cartesian grids.
Another sort of topologies are physical topologies reflecting the hardware structure on which the application was run. A typical three-dimensional physical topology is given by the (hardware) nodes in the first dimension, and the arrangement of cores/processors on nodes in further two dimensions.
The CUBE display supports multi-dimensional Cartesian grids, where grids with high dimensionality can be sliced or folded down to two or three dimensions for presentation. If the currently opened cube file defines one or more such topologies, separate tabs are available for each using the topology name when one is provided. The topology display shows performance data mapped onto the Cartesian topology of the application. The corresponding grid is specified by the number of dimensions and the size of each dimension. Threads/processes are attached to the grid elements, as specified by the CUBE file. Not all system items have to be attached to a grid element, and not every grid element has a system item attached. An example of a three-dimensional topology is shown on Figure topology. Note that the topology toolbar is enabled when a topology is available to be displayed.
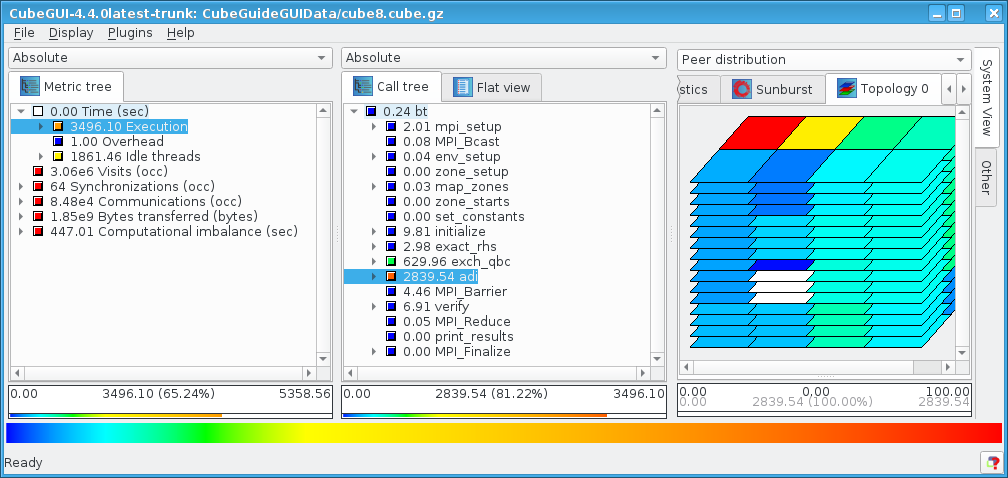
The Cartesian grid is presented by planes stacked on top of each other in a three dimensional projection. The number of planes depends on the number of dimensions in the grid. Each plane is divided into tiles (typically shown as rombi). The number of tiles depends on the dimension size. Each tile represents a system resource (e.g., a process) of the application and has a coordinate associated with it.
The current value of each grid element (with respect to the selections on the left-hand side and to the current value mode) is represented by coloring the grid element. Coloring is based on a value scale from  to
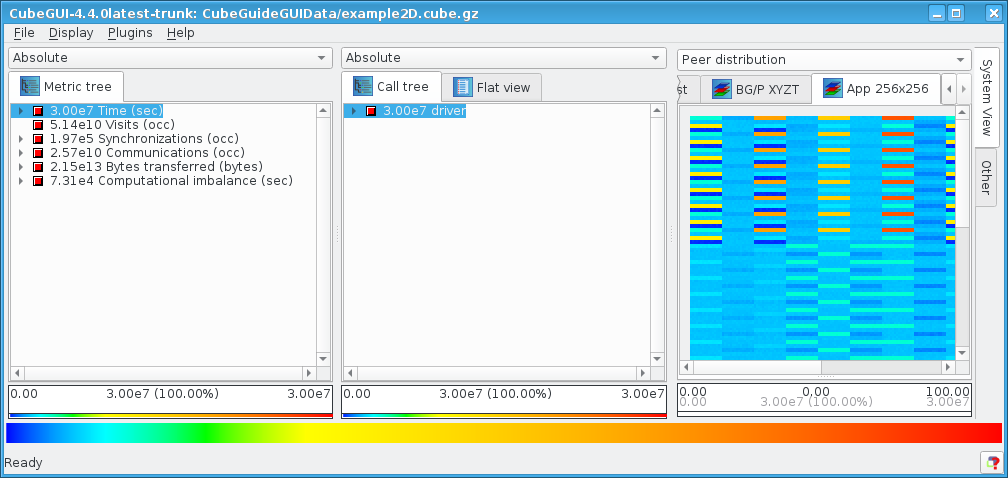
to  . Grid elements without having a system item attached to it are colored gray. See Section Menu Bar (menu Topology) for further topology-specific coloring settings. For example, the upper topology in Figure topology is drawn wit black lines, the 2D topology in Figure topology2D is drawn without lines.
If the selected system item occurs in the topology, it is marked by an additional frame and by additional lines at the side of the plane which contains the corresponding grid point, such that the selected item's position is also visible if the corresponding plane is not completely visible.
If zooming into planes is enabled, the plane containing the recently selected item is selected and the plane distance is adjusted to show this plane complely.
Selecting a collapsed tree in the system tree selects all its children in the topology view.
Besides the functions offered by the topology toolbar (see toolbar), the following functionality is supported:
Item selection: You can change the current system selection by left-clicking on a grid element which has a system item assigned to it (resulting in the selection of that system item). Multiple items may be selected or deselected by holding down the Ctrl key while clicking on an item.
If the number of topology dimensions is larger than three, the first three dimensions are shown and an additional control panel appears below the displayed topology. This panel allows rearranging topology dimensions on the x, y and z axes, as well as slicing or folding of higher dimensionality topologies for presentation in three or fewer dimensions.
Rearranging topology dimensions is achieved simply by dragging the topology dimension labels to the desired axis. When dragged on top of an existing topology dimension label, the two are exchanged.
When slicing, select up to three of the dimensions to display completely and choose one element of each of the remaining dimensions. The example in Figureexample4d shows a topology with 4 dimensions (32x16x32x4) labelled X, Y, Z and T. The first element of the 4th dimension (T) is automatically selected. By clicking on the button above the T, an index in this dimension from 0 to 3 can be chosen. If the index is set to all, the selection becomes invalid until an index of another dimension is selected.
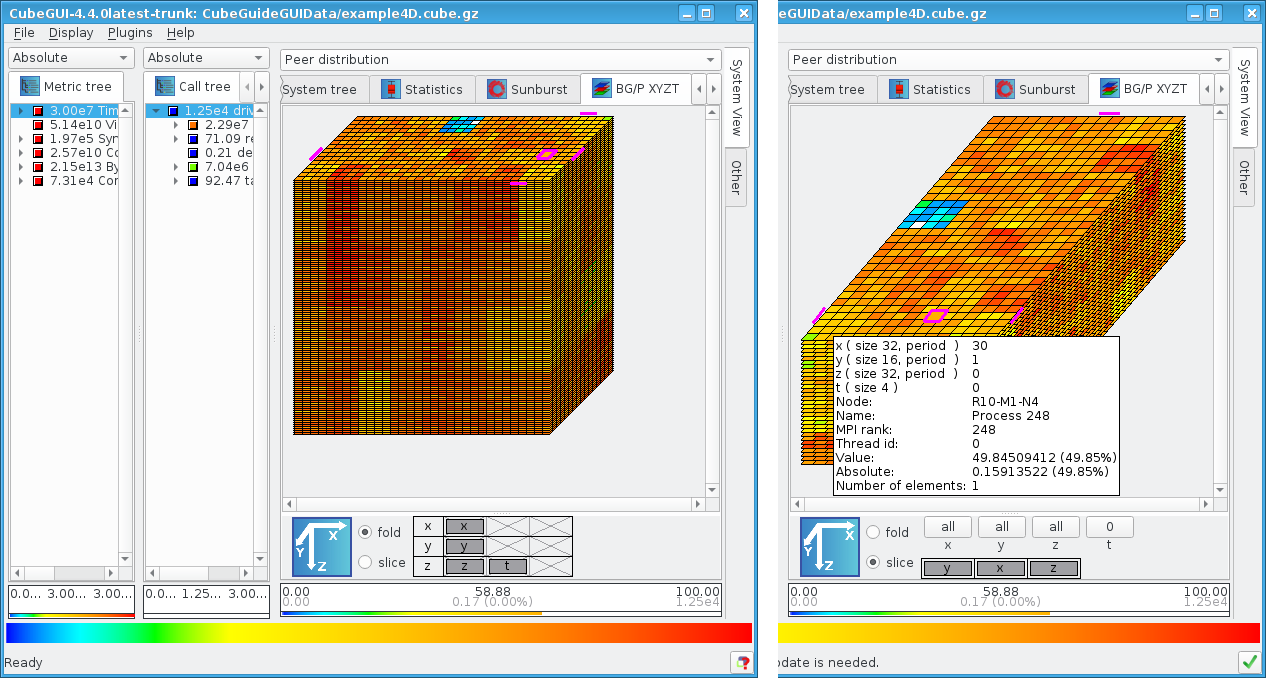
Alternatively, the folding mode can be activated by clicking on the fold button. This mode is available for topologies with four to six dimensions and allows to display all elements by folding two dimensions into one. Every dimension appears in a box, with can be dragged into one of the three container boxes for the displayed dimensions x, y and z. In folding mode, the color of the inner borders is changed into gray. The black bordered rectangles show the element borders of each of the three displayed dimensions.
The right image in Figureexample4d shows the folding of dimension Z with dimension T. One element with index (0,0,1,3) has been selected by clicking with the right mouse button into it. All elements inside the black rectancle around the selection belong to Z index one. The gray lines devide the rectangle into four elements which correspond to the elements of dimension T with index 0 to 3.
Item coloring: Offers a choice how zero-valued system nodes should be colored in the topology display. The two offered options are either to use white or to use white only if all system leaf values are zero and use the minimal color otherwise.
Line coloring: Allows to define the color of the lines in topology painting. Available colors are black, gray, white, or no lines.
Toolbar: This menu item allows to specify if the topology toolbar buttons should be labeled by icons, by a text description, or if the toolbar should be hidden. For more information about the toolbar see Section toolbar .
Show also unused hardware in topology: If not checked, unused topology planes, i.e., planes whose grid elements don't have any processes/threads assigned to, are hidden. Unused plane elements, if not hidden, are colored gray.
Topology antialiasing: If checked, anti-aliasing is used when drawing lines in the topologies.
The system pane may contain topology displays if corresponding data is specified in the CUBE file. Basically, a topology display draws a two- or three-dimensional grid, in the form of some planes placed one above the other. Each plane consists of a two-dimensional grid of processes or threads.
The toolbar is enabled only if the system pane shows a topology display, and it offers functions to manipulate the display of the above grid planes. The toolbar can be labeled by icons, by text, or it can be hidden, see menu Topology => Toolbar in Section Menu Bar. The toolbar buttons have tool tips, i.e., a short description pops up if the toolbar is enabled and you move the mouse above a button.
The functions are the following, listed from the left to the right in the topology toolbar:


(u)'' foruser-defined'' behind the minimal and maximal color values. Using the grip at the left of the toolbar, it can be dragged to another position or detached entirely from the main window. The toolbar can also be closed after a right-click in the grip.
| <left-mouse click> | select item |
| <right-mouse click> | context information |
| Ctrl+<left-mouse drag> | increase plane distance |
| Shift+<left-mouse drag> | move topology |
| < scroll mouse-wheel > | zoom in/out |
| <left-mouse drag> | rotate topology |
| Up arrow | scroll one unit up |
| Down arrow | scroll one unit down |
| Page up | scroll one page up |
| Page down | scroll one page down |
 |
Copyright © 1998–2017 Forschungszentrum Jülich GmbH,
Jülich Supercomputing Centre
Copyright © 2009–2015 German Research School for Simulation Sciences GmbH, Laboratory for Parallel Programming |