 |
Cube GUI User Guide
(CubeGUI 4.4.4, revision 18494)
Introduction in Cube GUI and its usage
|
|
Cube GUI User Guide
(CubeGUI 4.4.4, revision 18494)
Introduction in Cube GUI and its usage
|
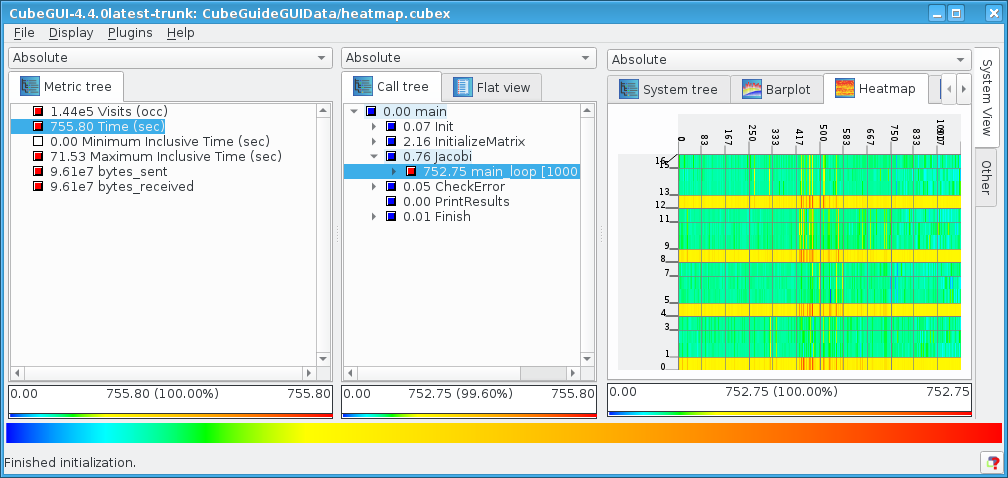
HEATMAP plugin is a CUBE plugin that represents the value of the thread in each iteration, as colors. The User can apply different metrics and call paths on heatmap graph.
As a start point, it should be mentioned that HEATMAP works only on CUBE file that has iterations. For those files which have not, user would face the warning on the terminal : "No iterations for Heatmap" and the plugin will not be shown.
By loading the plugin, on system dimension, the corresponding tab, Heatmap, will be added. Figure heatmap1 displays a view of it.
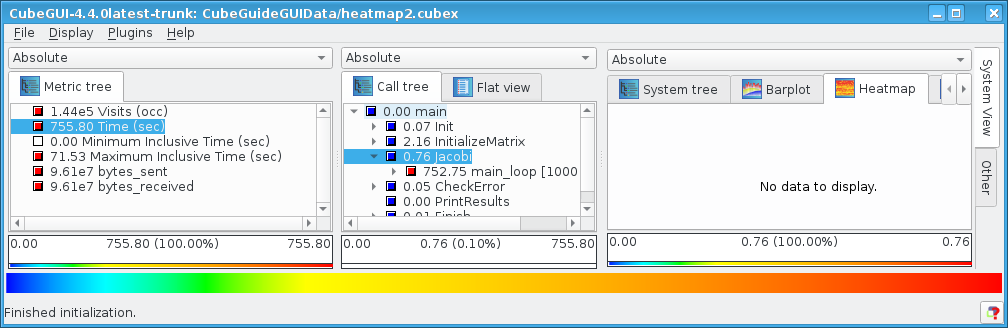
User can select different metrics such as Visits and Time, by clicking on them in metric dimension. In addition, it is possible to get a HEATMAP for different call paths of iterations, via clicking on them. However, for call paths that are not located in iterations, like input_in figure heatmap2, no heatmap graph is displayed and user face the message "No data to display" on a window.
Furthermore, the values on HEATMAP, can be evaluated in Inclusive and Exclusive manner. Therefore, user can easily collapse the tree on call path and click on the desired path to get the exclusive value of it.
Additionally, the exact calculated values can be seen by clicking left button of mouse on the desired position on the graph, a tooltip would display a value corresponding to the iteration.
In a situation that user needs to store the graph, it is just needed to do right click on a graph, and select "Save as image", then the Save dialog will be opened to specifying the path and name of the PNG file.
Plugin menu offers the general function to enable or disable a plugin, and specific functions for each plugin. Heatmap plugin provides the following functions in two areas, horizontal tick and vertical ticks(Figure heatmapmenupic).
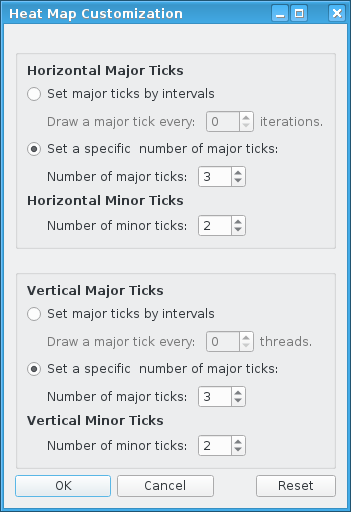
Horizontal ticks: For adjusting the major horizontal ticks, user can set the drawing intervals or the number of ticks. By specifying the number of major ticks, the width of the horizontal axis will be divided to the specified number and major ticks are drawn by length longer than minor ticks. Then in each divided length, if there is enough space, the specified number of minor ticks will be displayed.
Also, it is possible that the user set major ticks by interval of iterations. In order to do that, select the major ticks by interval option, and set the interval. Therefore, after each specified number of iterations, one major tick will be drawn.
Vertical ticks: For adjusting the major vertical ticks, user can set the drawing intervals or the number of ticks. By specifying the number of major ticks, the length of the vertical axis will be divided to the specified number and major ticks are drawn by length longer than minor ticks. Then in each divided length, if there is enough space, the specified number of minor ticks will be displayed.
Also, it is possible that the user set major ticks by interval of threads. In order to do that, select the major ticks by interval option, and set the interval. Therefore, after each specified number of threads, one major tick will be drawn.
 |
Copyright © 1998–2017 Forschungszentrum Jülich GmbH,
Jülich Supercomputing Centre
Copyright © 2009–2015 German Research School for Simulation Sciences GmbH, Laboratory for Parallel Programming |