 |
Cube GUI User Guide
(CubeGUI 4.6, revision ff50a50d)
Introduction in Cube GUI and its usage
|
|
Cube GUI User Guide
(CubeGUI 4.6, revision ff50a50d)
Introduction in Cube GUI and its usage
|
In this section we will explain two features – namely the display of statistical information about performance patterns which represent performance problems and the display of the most severe instances of these patterns in a trace browser – which both are only available if a statistic file for the currently opened CUBE file is present. Currently, such a statistic file can be generated by the SCOUT analyzer . The file format of statistic files is described in the Appendix .
For CUBE to recognize the statistic file, it must be placed in the same directory as the CUBE file. The basename of the statistic file should be identical to that of the CUBE file, but with the suffix .stat. For example, when the CUBE file is called trace.cubex, the corresponding statistic file is called trace.stat.
If a statistic file is provided, you can view statistical information about one or multiple patterns (for example in order to compare them). This is done by selecting the desired metrics in the metric-tree and then selecting the Statistics menu item in the context menu. This brings up the box plot window as shown in Figure boxPlot.
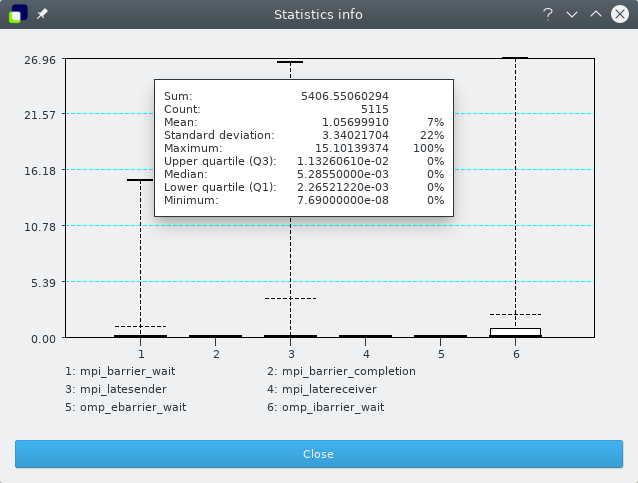
The box plot shows a graphical representation of the statistical data of the selected patterns. The slender black lines on the top and the bottom designate the maximum and the minimum measured severity of the pattern, respectively. The lower and the upper borders of the white box indicate the values of the 25% and 75% quantile. The thick line inside the box represents the median of the values, while the dashed line indicates the mean.
There are two ways of interacting with the box plot. You can zoom to a certain interval on the y-axis by clicking on a position with the height of the desired maximal or minimal value and by consecutively dragging the mouse to a position with the height of the corresponding other extreme value. You can reset the view (i.e., to undo all zooming) by clicking the middle mouse button somewhere on the box plot.
If you are interested in more precise values for the severity statistics of a certain metric, you can click with the left mouse button somewhere in the column of the desired metric, which will yield a small window (as shown in the top right corner of Figure boxPlot) displaying the exact values of the statistics. Clicking with the right mouse button shows the information in a tooltip.
If a statistic file also contains information about the most severe instances of certain patterns, CUBE can be connected to a trace browser (currently only Vampir is supported) in order to view the state of the program being analyzed at the time this most severe pattern instance occurred. For collective operations, the most severe instance is the one with the largest sum of the waiting times of all processes, which is not necessarily the one with the largest maximal waiting time of each individual process.
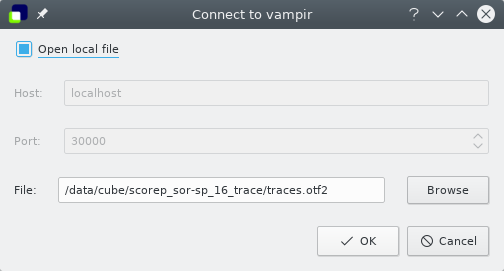
To use this feature, you first have to connect to a trace browser by using the Connect to menu item of the Vampir Plugin submenu of the Plugin menu. This will open one of the two dialog windows shown below.
For Vampir, you have to specify the host name and port of the Vampir server you want to connect to and the path of the trace file you want to load. This will launch the Vampir client (if it is correctly configured) and load the specified trace file. To configure Vampir so that it can be started automatically by CUBE, a service file com.gwt.vampir.service, describing the path to your Vampir client executable must be placed under (/usr/share/dbus-1/service) or ${HOME}/.local/share/dbus-1/services. This service file must be exactly as shown below, with the exception that Exec should point to your Vampir client executable.
[D-BUS Service]
Name=com.gwt.vampir
Exec=/private/utils/bin/vng
An example of the com.gwt.vampir.service file
Once CUBE is connected to a trace browser you can select the Max severity in trace browser menu item of the metric-tree so that all connected trace browsers are zoomed to the (globally) most severe instance of the selected pattern.
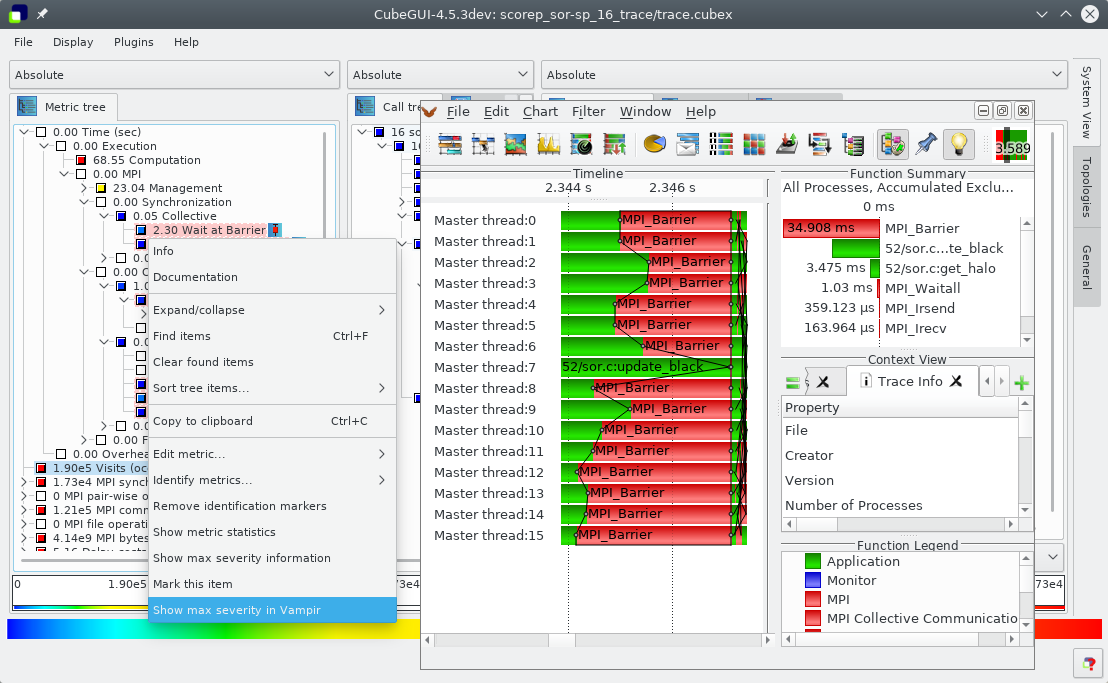
A more sophisticated feature of CUBE is the ability to zoom to the most severe instance of a pattern in a selected call path. This can be done by selecting a metric in the metric-tree which will highlight the most severe call paths in the call-tree. You can then use the context menu of the call tree to select the Max severity in trace browser menu item which will then zoom all connected trace browsers to the most severe instance of the selected pattern with respect to the chosen call path (see Figure VampirPlugin).
user@host: vampir --dbus&
.bashrc file following code snippet: ## test for an existing bus daemon, just to be safe
if test -z "$DBUS_SESSION_BUS_ADDRESS" ; then
## if not found, launch a new one
eval `dbus-launch --sh-syntax`
echo "D-Bus per-session daemon address is: $DBUS_SESSION_BUS_ADDRESS"
fi The current state of a cube instance (selections, expanded tree items, ...) can be synchronized with other cube instances on the same or on different machines. The synchronization function uses the clipboard to exchange data, so no network protocol is required. Synchronization can be useful e.g. for following tasks:
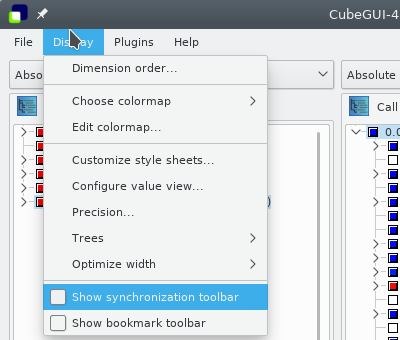
To enable Synchronization, the corresponding toolbar has to be enabled (Figure sync1). Press the toolbar button with the red outgoing arrow to enable sending of status information. The current state is sent when the button is activated and after every change while the button is checked. To receive status information press the button with the white incoming arrow. If activated, cube listens for changed status information.
Tree items are identified by their label, not by the position in the tree.
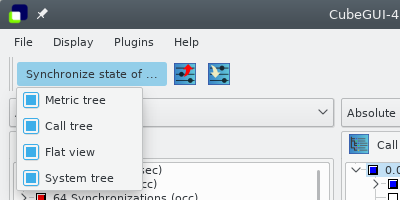
With the "Synchronize state" menu, you can select the information that is sent and received. By default, this is the state of the four trees. If you want to show different metrics in each cube instance, but synchronize the selected callpath and system-tree, you have to disable "Metric tree" (Figure sync2).
 |
Copyright © 1998–2021 Forschungszentrum Jülich GmbH,
Jülich Supercomputing Centre
Copyright © 2009–2015 German Research School for Simulation Sciences GmbH, Laboratory for Parallel Programming |