 |
Cube GUI User Guide
(CubeGUI 4.6, revision ff50a50d)
Introduction in Cube GUI and its usage
|
|
Cube GUI User Guide
(CubeGUI 4.6, revision ff50a50d)
Introduction in Cube GUI and its usage
|
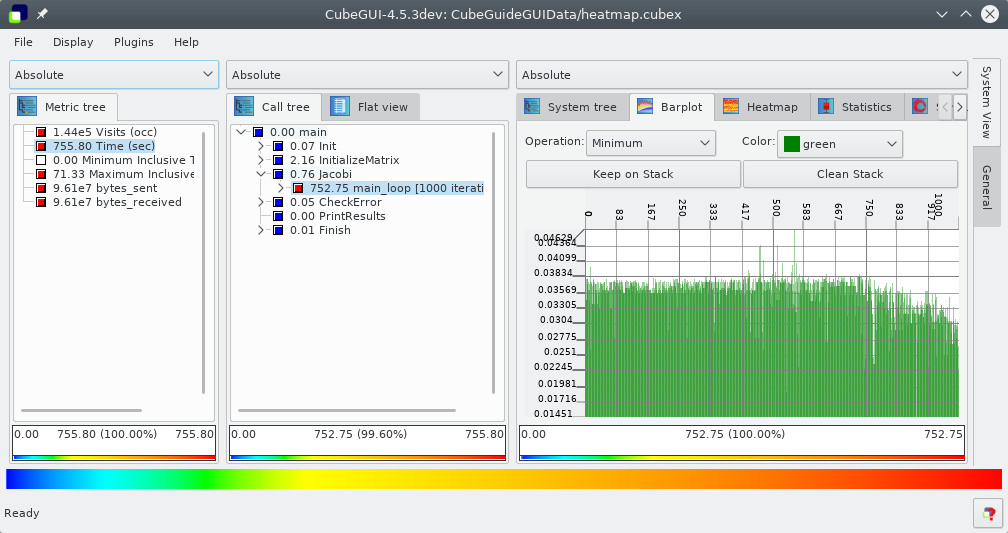
BARPLOT plugin is a CUBE plugin that plots vertical bar graph for the CUBE file which has iterations. Horizontal axis shows different iterations being compared and on vertical axis, several operations can be used to represent the value. The User can apply different metrics and call paths on the bar graph.
As a start point, it should be mentioned that BARPLOT works only on a CUBE file that has iterations. For those files which have not, user would face the warning on the terminal : "No iterations for Barplot" and the plugin will not be shown.
By loading the plugin, on system dimension, the corresponding tab, Barplot, will be added. In the Barplot tab, the user can select different operations and assign desired color to them. Figure barplot1 displays a view of it.
User can select different metrics such as Visits and Time, by clicking on them in metric dimension. In addition, it is possible to get a BARPLOT for different call paths of iterations, via clicking on them. However, for call paths that are not located in iterations, like input_in in figure barplot2, no bar graph is displayed and user face the message "No data to display" on the window.
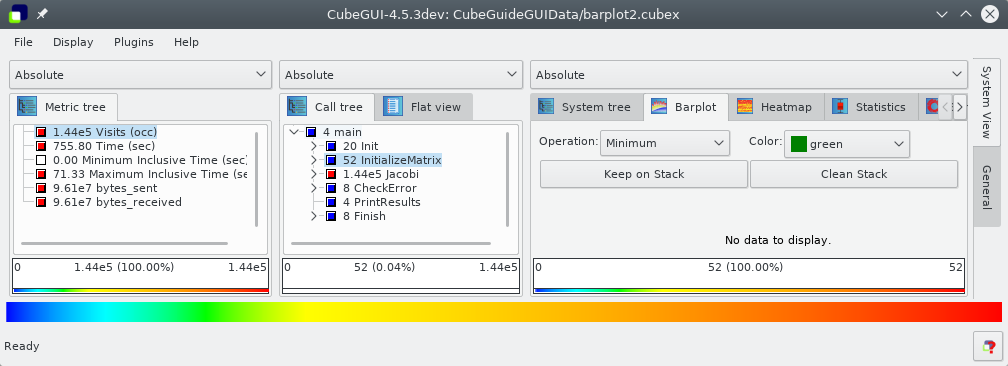
Furthermore, the values on BARPLOT, can be evaluated in Inclusive and Exclusive manner. Therefore, user can easily collapse the tree on call path and click on the desired path to get the exclusive value of it.
Additionally, the exact calculated values can be seen by clicking left button of mouse on the desired position on the graph, a tooltip would display a value corresponding to the iteration.
In a situation that user needs to store the graph, it is just needed to do right click on a graph, and select "Save as image", then the Save dialog will be opened to specifying the path and name of the PNG file.
On the top of the Barplot space, there is a toolbar that allows user to specify the kind of an operation and its color(Figure toolbar).
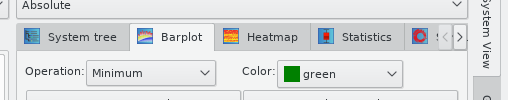
By operation item, the user can select different operations, Minimum, Maximum, Average, Median, 1st Quartile and 3rd Quartile or the combination of Maximum, Minimum and Average. This provides the situation for the user to have different values for comparing at one time. These operations are done on all threads in each iterations. For instance, by Minimum operation, the minimum value among the existing threads for each iteration, is calculated and plotted. They are kind of statistical measurements.
Color item offers a color for an operation, however for each operation, a default color is assigned automatically. By changing the operation, corresponding color will be shown on color combo box. In a situation that different bar graphs are overlaid on each other, each graph will be shown by different color in order to distinguish various graphs.
In addition to above items, two buttons are also designed to manage the order of the bar graphs.
Keep on Stack: It is possible that user intents to compare different graphs by laying them on each other. For this matter, a push-button keep on stack is defined. Generally, by clicking on each call path or metric, a responding graph is replaced the previous one in the stack. In a situation, that the user intends to compare the next graph by the existing one, at one time, it is needed to click on the button keep on the stack, then the next graph will be added over the previous one, or in another words, it is overlaid on the last graph. If its values are less than the previous graph, user can see two graphs by different colors that help him/her in comparing, and in a situation that new values are greater than previous one, the new one will cover the previous with fresh color. Therefore, for keeping the top row of the stack, the user should click on the keep the stack button, otherwise the coming values will replace the last one.
Clean Stack: By clicking this button, all displayed graphs, are erased and the stack will be empty.
Plugin menu offers the general function to enable or disable a plugin, and specific functions for each plugin. Barplot plugin provides the following functions in two areas, Measurement Customization and Threads Ruler Customization(Figure barplotmenupic).
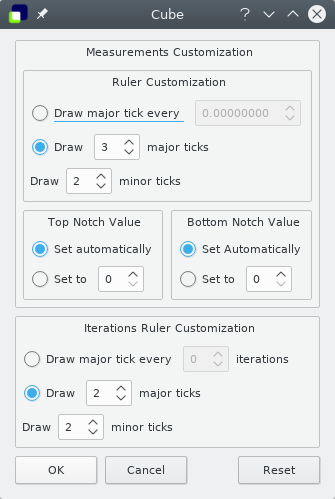
Ruler Customization: User can modify the number of major and minor ticks of the ruler on vertical axis. For adjusting the major vertical ticks, user can set the drawing intervals or the number of ticks. By specifying the number of major ticks, the length of the vertical axis will be divided to the specified number and major ticks are drawn by length longer than minor ticks. Then in each divided length, if there is enough space, the specified number of minor ticks will be displayed. It is possible that the user set major ticks by interval. In order to do that, select the major ticks by interval option, and set the interval value. Therefore, after each interval, one major tick will be drawn.
Top Notch Value: The value of the top notch on a vertical axis can be altered by user as well as automatically. Therefore, due to scale issue, it can affect on the drawing of the graph.
Button Notch Value: The value of the button notch on a vertical axis can be altered by user as well as automatically. Therefore, due to scale issue,it can affect on the drawing of the graph.
Iterations Ruler Customization: User can modify the number of major and minor ticks of the ruler on horizontal axis. For adjusting the major horizontal ticks, user can set the drawing intervals or the number of ticks. By specifying the number of major ticks, the width of the horizontal axis will be divided to the specified number and major ticks are drawn by length longer than minor ticks. Then in each divided length, if there is enough space, the specified number of minor ticks will be displayed. It is possible that the user set major ticks by interval of iterations. In order to do that, select the major ticks by interval option, and set the interval. Therefore, after each specified number of iterations, one major tick will be drawn.
 |
Copyright © 1998–2021 Forschungszentrum Jülich GmbH,
Jülich Supercomputing Centre
Copyright © 2009–2015 German Research School for Simulation Sciences GmbH, Laboratory for Parallel Programming |