 |
Cube GUI User Guide
(CubeGUI 4.4.4, revision 18494)
Introduction in Cube GUI and its usage
|
|
Cube GUI User Guide
(CubeGUI 4.4.4, revision 18494)
Introduction in Cube GUI and its usage
|
This plugin adds a statistics display tab next to the system tree tab. It shows the value distribution either in a box plot or in a violin plot.
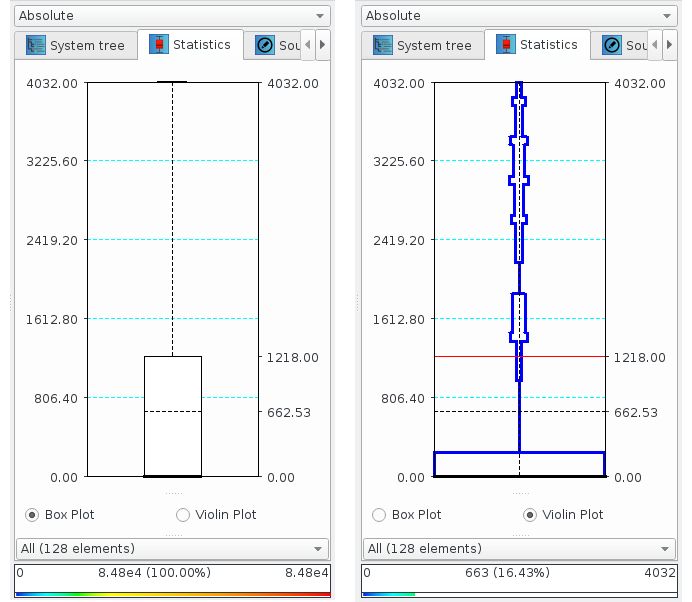
The box plot shows a box-and-whisker distribution of metric severity values for the currently active subset of system resources (typically threads). The active subset is changed via the combobox menu at the bottom of the pane, and the y-axis scale is adjusted via the display mode combobox at the top of the pane.
The vertical whisker ranges from the smallest value (minimum) and to the largest value (maximum), while the bottom and top of the box mark the lower quartile (Q1) and upper quartile (Q3). Within the box, the bold horizontal line represents the median (Q2) and the dashed line the mean value.
The violin plot is an alternative method of plotting statistical data, which additionally shows the distribution of the data. It is a box plot with a rotated kernel density plot on each side. The violin plot shows a thick black line for the median of the data, a dotted line for the mean, and red lines for quartiles.
To see the statistics as numeric values in a separate window, use <left-mouse click> inside the chart. Zooming into the boxplot is done with <left-mouse drag> from top to bottom, and reset with a <middle-mouse click> inside the chart.
 |
Copyright © 1998–2017 Forschungszentrum Jülich GmbH,
Jülich Supercomputing Centre
Copyright © 2009–2015 German Research School for Simulation Sciences GmbH, Laboratory for Parallel Programming |